


Whether you're transforming rows into columns, aggregating values, or preparing data for visualization, the Crosstab Tool offers a simple yet powerful way to pivot your dataset. In this blog, I’ll explore how the Crosstab Tool fits into the Alteryx workflow, walk through practical use cases, and share tips to help you get the most out of this dynamic tool.
The Crosstab Tool in Alteryx is used to pivot data, turning rows into columns and aggregating values as needed. It's especially useful when preparing data for reporting or analysis, allowing for a more structured and readable format.

Once you have dragged in a crosstab tool into your flow, and connected it with a data input, you will be met with this view in the configuration window:
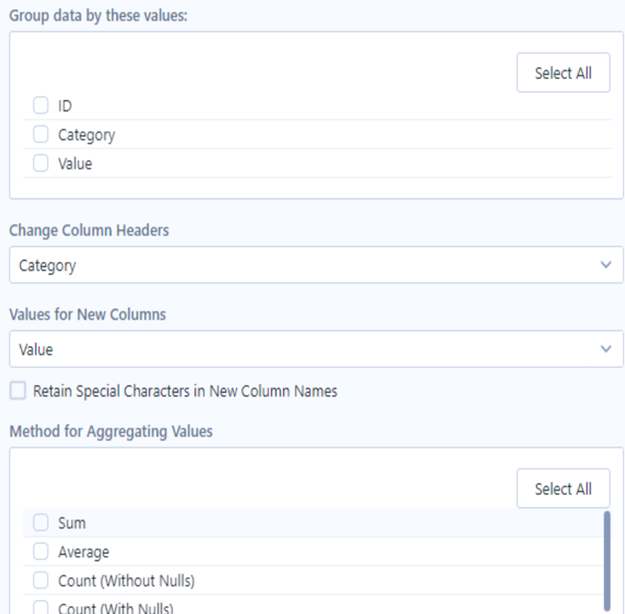
The method by which I begin to approach this configuration window, and perform an accurate crosstab, is by dividing it into four key questions that each relate to a section in the configuration window:
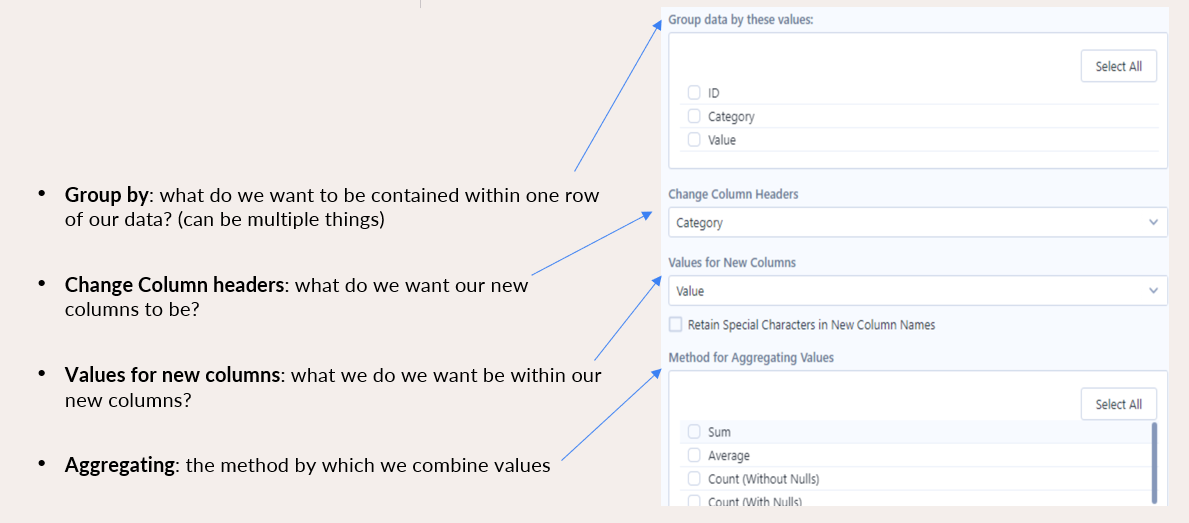
1) What do we want to be contained within one row of our data? (can be multiple things)
2) What do we want our new column headers to be?
3) What do we want the values beneath those new column headers to be?
4) What is our aggregation method? These options may change depending on the type of data you are aggregating:
Options for String data include:
- Concatenate: Separates the values using the separator specified in the Separator field.
- First: Displays the first found value.
- Last: Displays the last found value.
- Count Distinct (Without Nulls): Counts the number of distinct values excluding null values.
- Count Distinct (With Nulls): Counts the number of distinct values including null values.
Options for Numeric data include:
- Sum: Sums the values.
- Average: Calculates an average of the values.
- Count (Without Nulls): Counts the number of values excluding null values.
- Count (With Nulls): Counts the number of values including null values.
- Count Distinct (Without Nulls): Counts the number of distinct values excluding null values.
- Count Distinct (With Nulls): Counts the number of distinct values including null values.
- Percent Row: Calculates a percent based on the values.
- Percent Column: Calculates a percent based on the values.
- Total Column: Totals all of the values.
- Total Row: Adds a new row containing a total of the values.
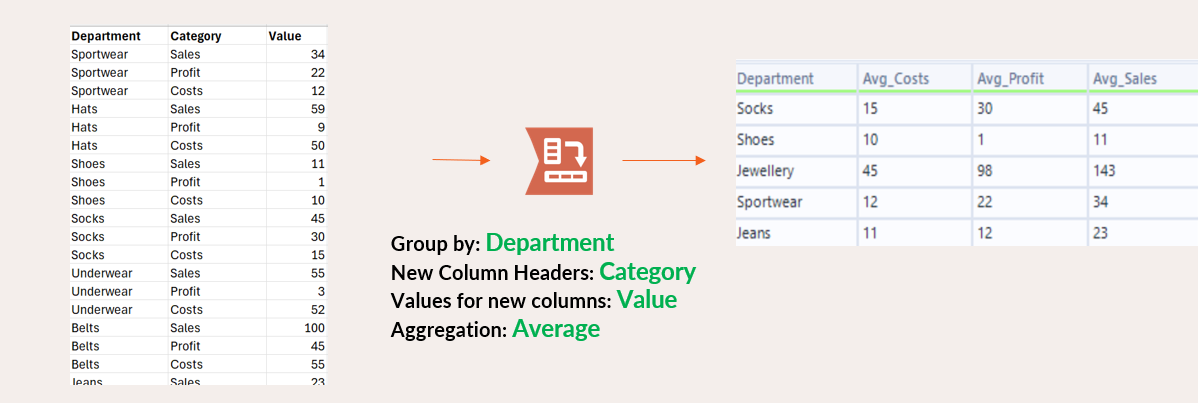
For Example:
Once you can answer these questions it's very easy to relate them to the questions that Alteryx is indirectly asking you in the configuration window. See the following image to understand which questions relate to what sections of the configuration window:
The section: 'Retain Special Characters in New Column Names' refers to keeping/removing special characters within the column headers. Select the Retain Special Characters in New Column Names checkbox to keep any special characters in your column/field names. When the checkbox is unchecked, Alteryx replaces special characters in column names with an underscore (_) character.
Some common use cases for the Crosstab formula tool include:
. Creating summary tables
. Making datasets wider for easier analysis
. Improving visual understanding for human interpretation