Dashboard Week Day 1 Brief:
- Scrape the main Backpacker Index page:
 Roger Wade
- Scrape each city’s detail page:
- https://www.priceoftravel.com/montreal-price-guide
- Build a dashboard in a visualisation tool of choice
One of the biggest hurdles I ran into today was figuring out the appropriate REGEX to extract the specific data I needed. The main page had tons of different links—some useful, most not—and narrowing it down to just the ones I cared about was a constant game of trial and error. I’d write what I thought was the perfect regex, only to find it either grabbed too much or completely missed what I was targeting.
On top of that, a lot of the more detailed information I needed wasn’t even on the main page—it was buried under additional URLs. That meant I had to dynamically generate new requests from the links I’d already scraped and chain them together in Alteryx. Managing that, especially when the structure wasn’t consistent across all pages, became a whole new challenge.
When I brought the city names into Tableau to create a map, I expected it to be straightforward since the names were already correct. But surprisingly, Tableau’s geocoding just didn’t recognize some of them, even though they were spelled exactly right. It was frustrating—there was nothing wrong with the data itself, but Tableau still refused to plot certain cities. I had to experiment with adding country or region context just to get them to show up properly.
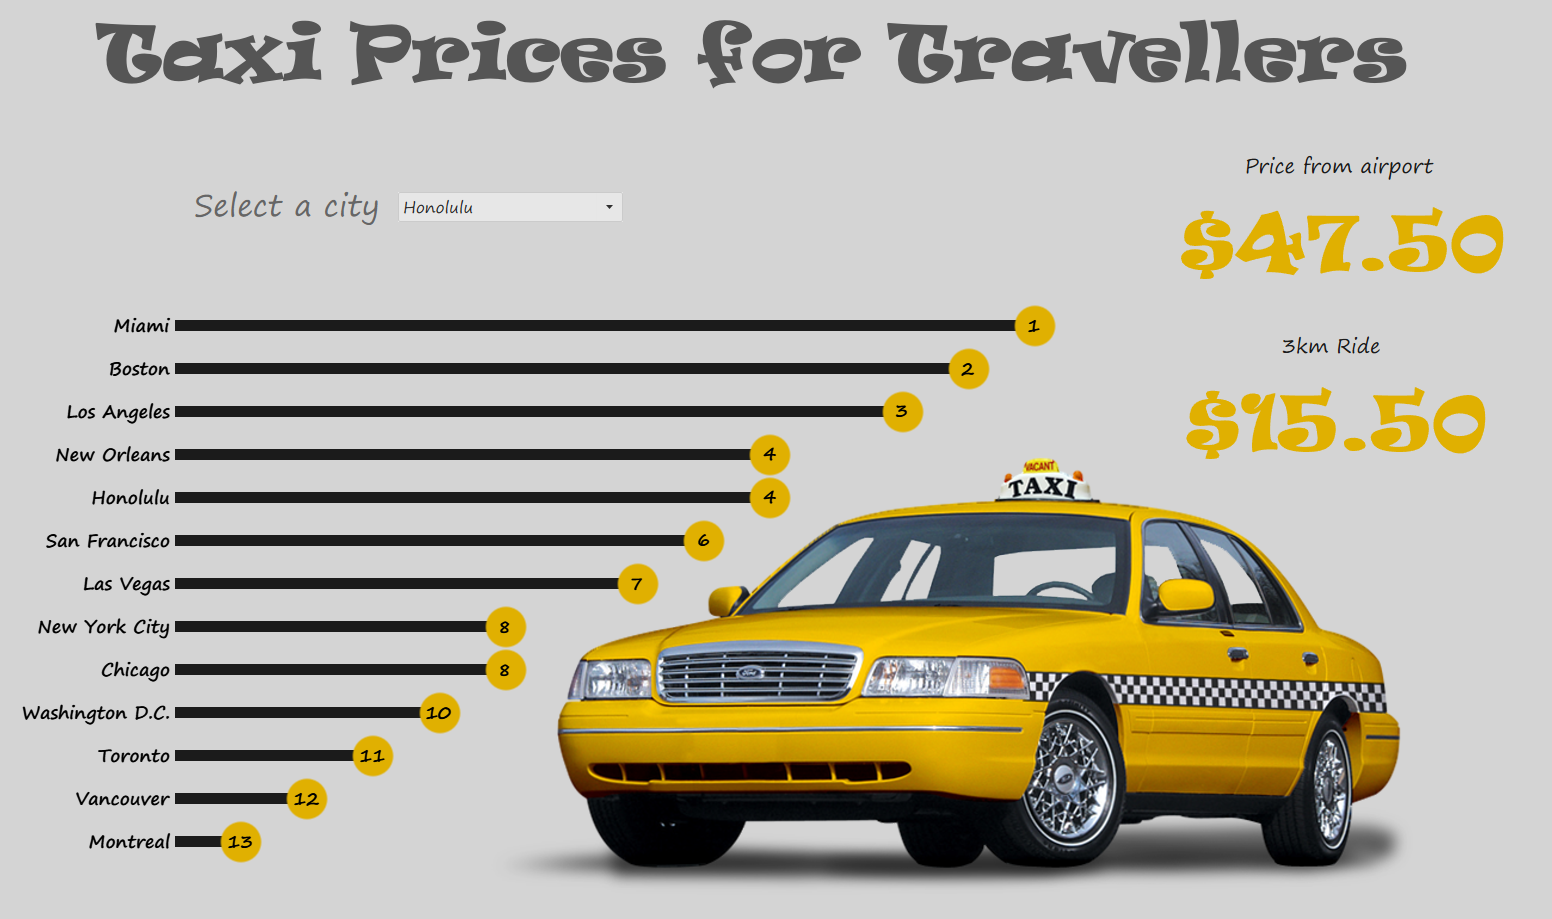
After overcoming these issues, cleaning and organizing the data, I built an interactive dashboard that ranks cities based on these two fares and visualizes the differences across locations.
The results highlight how taxi pricing varies globally—some cities are relatively affordable for short rides but have steep airport transfer costs, while others show the opposite trend. The dashboard helps surface these patterns and provides a clearer picture of urban transport costs in different regions.
Please see as follows for the dashboard:
https://public.tableau.com/app/profile/harry.caplin/viz/TaxiPricesforTravellers/TaxiPrices