For my final project this week, I worked with LEGO-related datasets to practice data integration and visualization. The first step involved using SQL queries in Snowflake to explore and join multiple data tables, ensuring the data was clean, well-structured, and ready for analysis. Once the data model was complete, I imported it into Power BI, where I designed and built an interactive dashboard. This dashboard allows users to explore various aspects of the LEGO dataset through dynamic visuals and filters, providing meaningful insights into the data.
SQL in Snowflake
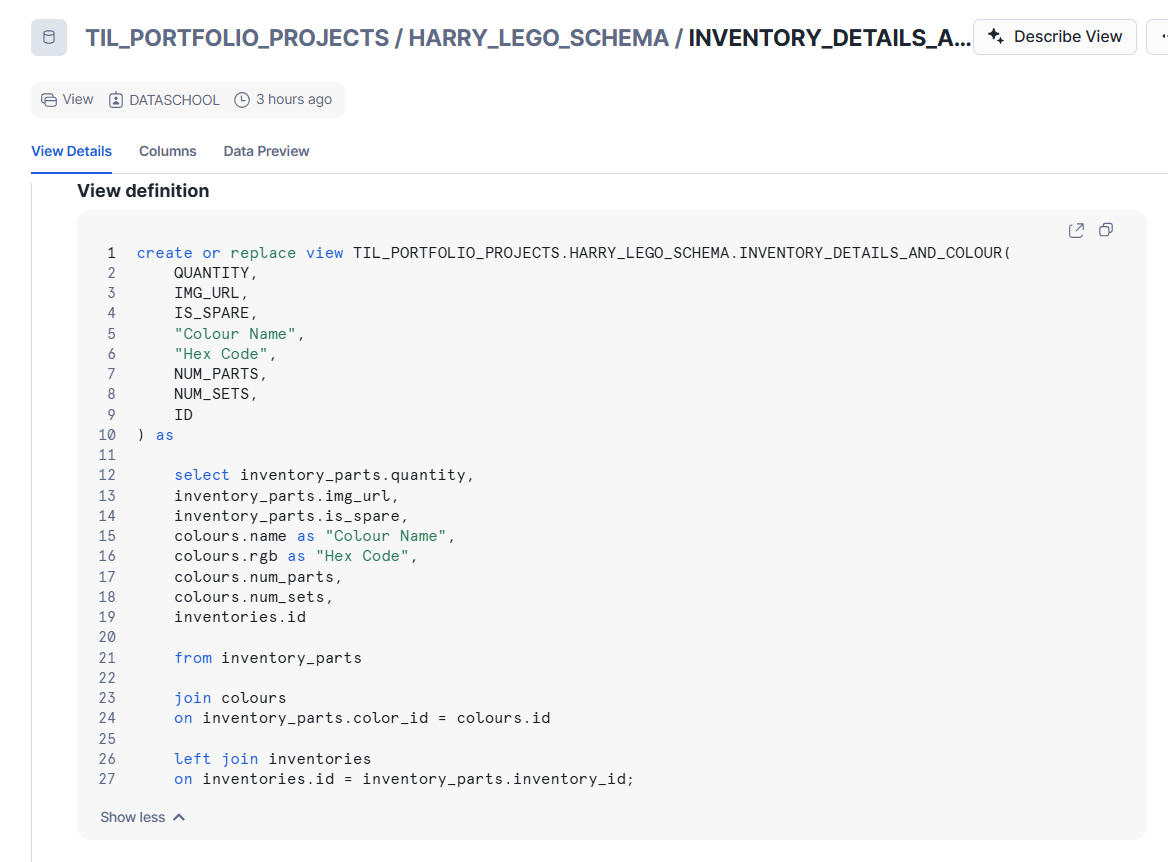
To organize the data effectively, I divided it into 12 separate tables based on logical groupings. I then used SQL to join and consolidate these tables into 3 distinct views, each representing a key aspect of the dataset. These views served as clean, structured sources that were ready to be imported and modeled in Power BI for visualization.
E.g:
PowerBI
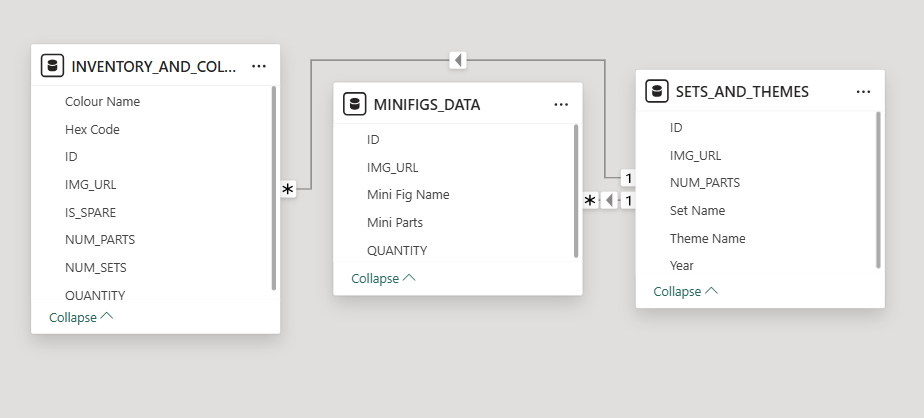
I then inputted these views into PowerBI to create the following model:
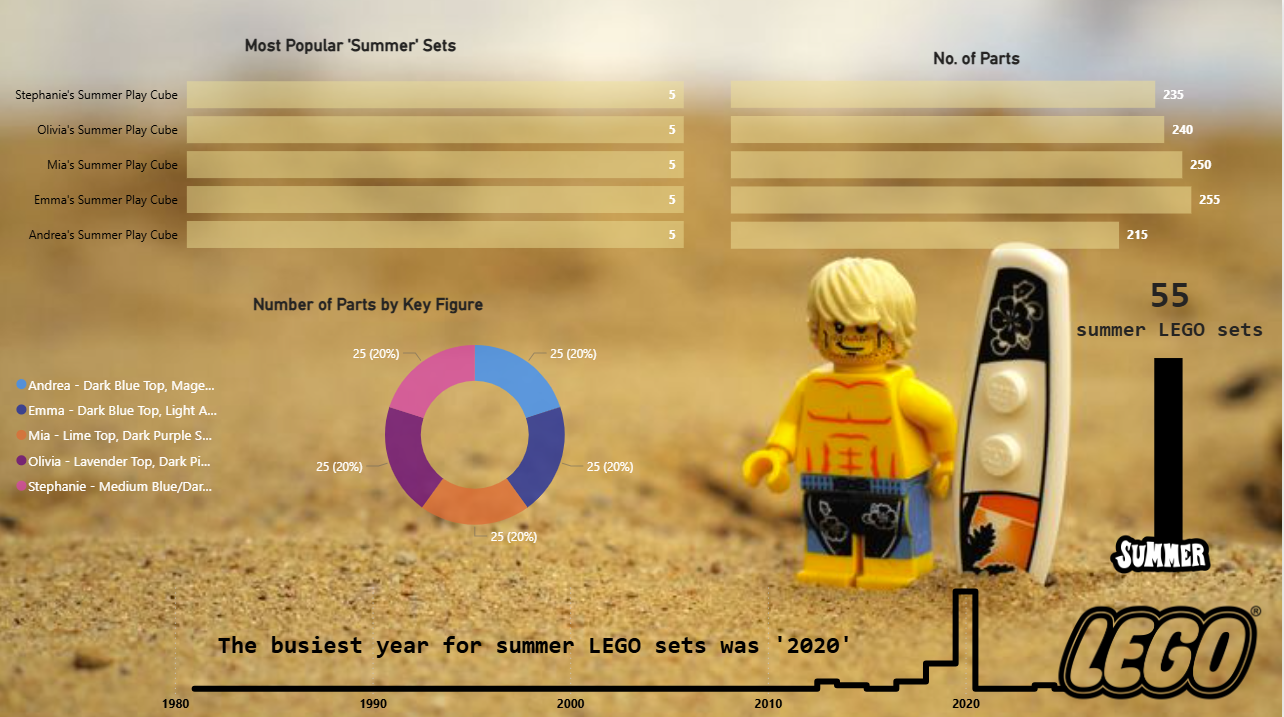
Which I then utilized to build my final dashboard which you can see as follows: