


For day 3 of Dashboard week we were given the task of using Power BI to analyse financial gifts to American Educational Institutions from foreign sources. Using Power BI was an enjoyable challenge and was useful in illuminating its similarities and differences to Tableau. The data itself was clean and so little data prep was required. I initially tried to supplement the data in order to generate some avenues of investigation which could lead to a story to tell with the data. However after spending most of the morning trying to find and join data sets to the original in Alteryx I decided to cut my losses.
I first tried to join the data set to one including the 2017 tuition fees and number of enrolments for each American University. However joining these files on name resulted in a lot of drop outs due to slightly different naming conventions. These differences varied across Institutions and it would’ve taken far too long to iron them all out. I tried joining a data set including the institutions ID but these seemed to have changed over time as there was a lot of drop out again. After facing the same problems with multiple American Educational Institution data sets and seeing it was almost lunch time I decided to just stick with the original data.
This meant my dashboard would be less focused down a specific story line and would instead be ore report like and informational. This turned out to be a good thing as Power BI excels in this regard. Whilst it felt more limited in the initial exploration of the data through the creation of different charts due to their strict template-filling nature, once I knew what I had a good idea of what I wanted the dashboard to show and look like it was very quick and easy to use. I made a quick plan of how I wanted the dashboard to look in paint (my laptop has touch screen) and then set about building the necessary charts.
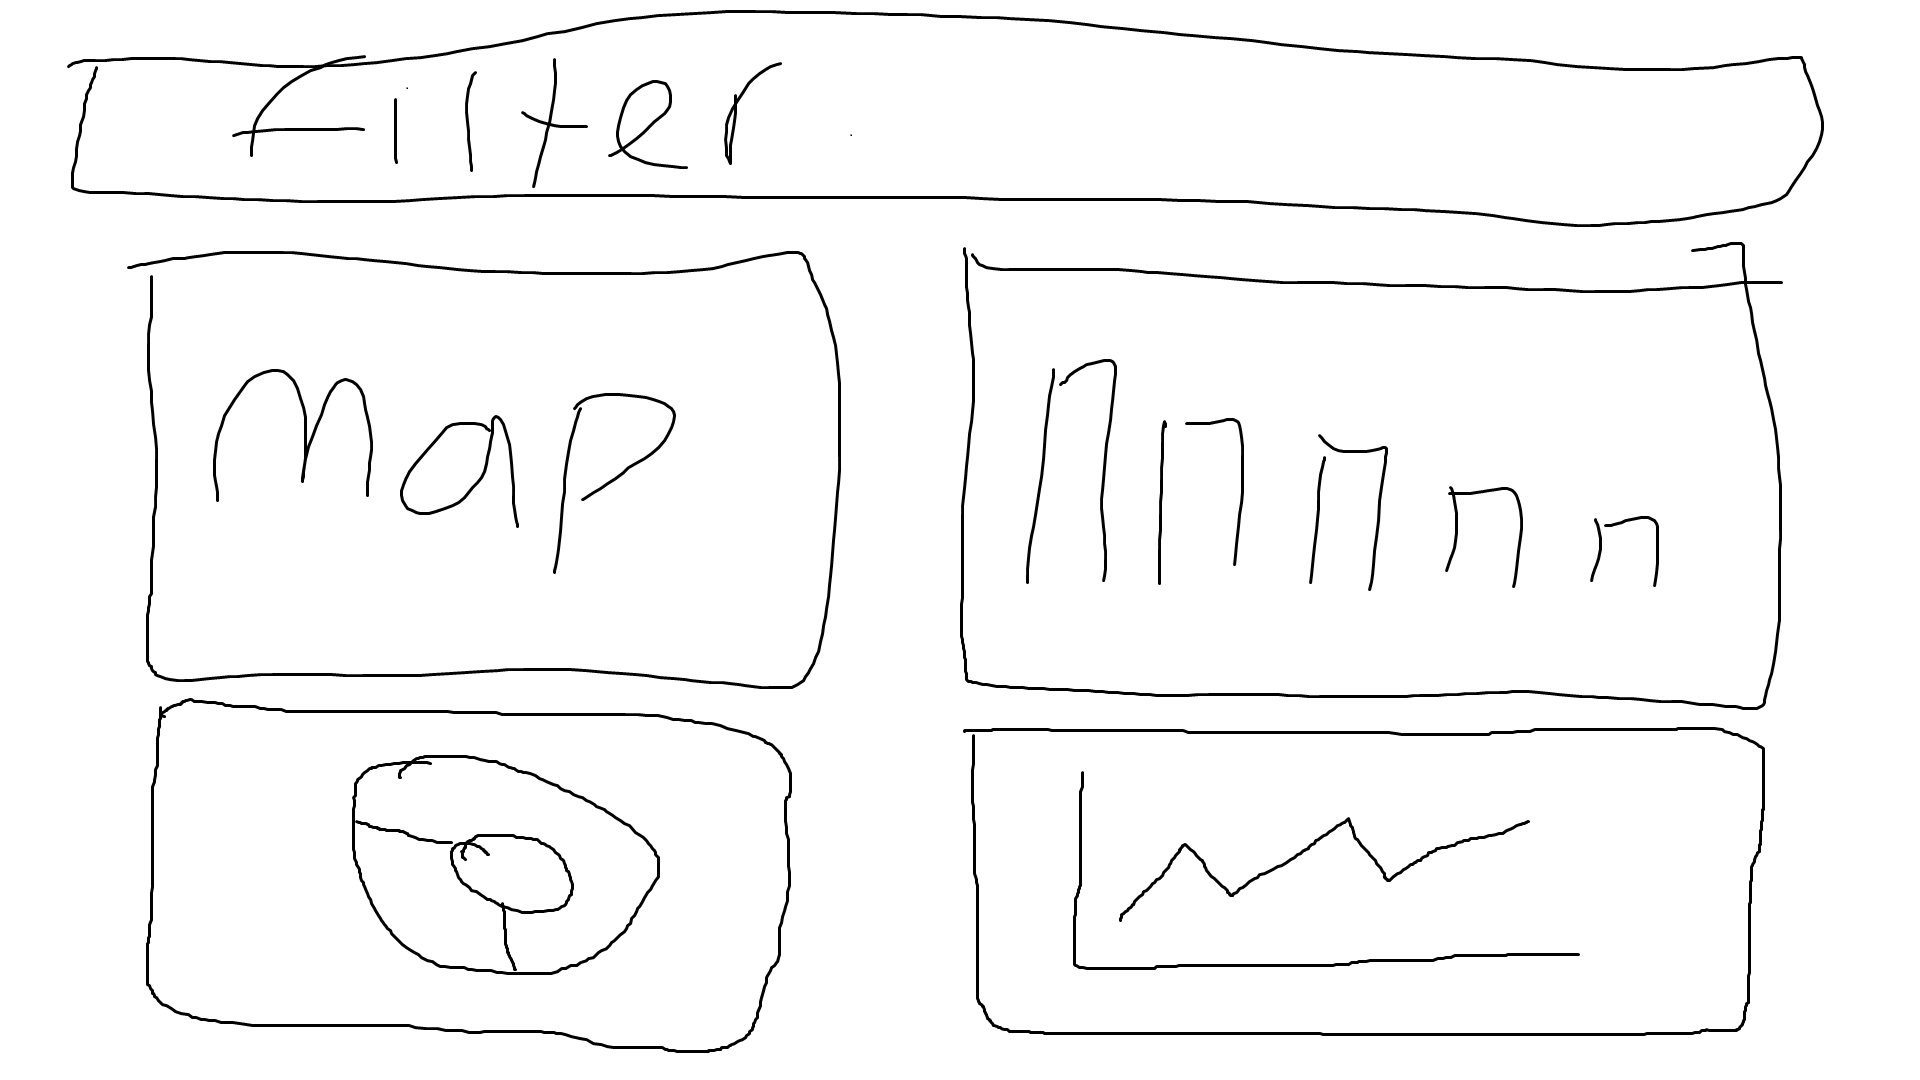
Plan in paint.
My plan was to have a dashboard showing the amount of donations from countries to American Institutions, broken down to show how much to each institution, which states received the most and how the gift amount varied over time. I liked the look of the splicer/filter tool when in horizontal mode and planned to have this across the top as a filter to select the countries. It ordered the countries alphabetically however, which wasn’t very useful in my dashboard. I wanted them to be ordered by total amount donated but was unable to find out how to do this. I found that whilst the Power BI community does seem to be active and questions are answered consistently online, it was harder to find cases of my specific question being asked. This is contrary to Tableau which will usually have had people encountering and receiving the solutions to similar problems before. I again decided to change my approach as I didn’t want to waste any more time.
I instead used a bar chart as the means to filter the countries. This was a better solution in the end I think, as it also allowed me to show the amount spent by each country visually as opposed to just in ranked order. This highlighting/filtering and general interactivity between charts was excellent in Power BI. I didn’t have to set up any actions it was just intuitive in knowing that when I click a certain bar, location etc I want the other views on the dashboard to also change. I also liked Power BI’s drill down features. They were easy to implement and allowed the dashboard to provide much more insight, I allowed the countries to be drilled down into the specific organisations giving the financial gift from that country, as well as the states receiving the gifts down into the cities within the state. At this point my layout had diverged from the initial plan but I was happy with it. I wanted to provide more detail however and knew that Power BI offers a drill though option.
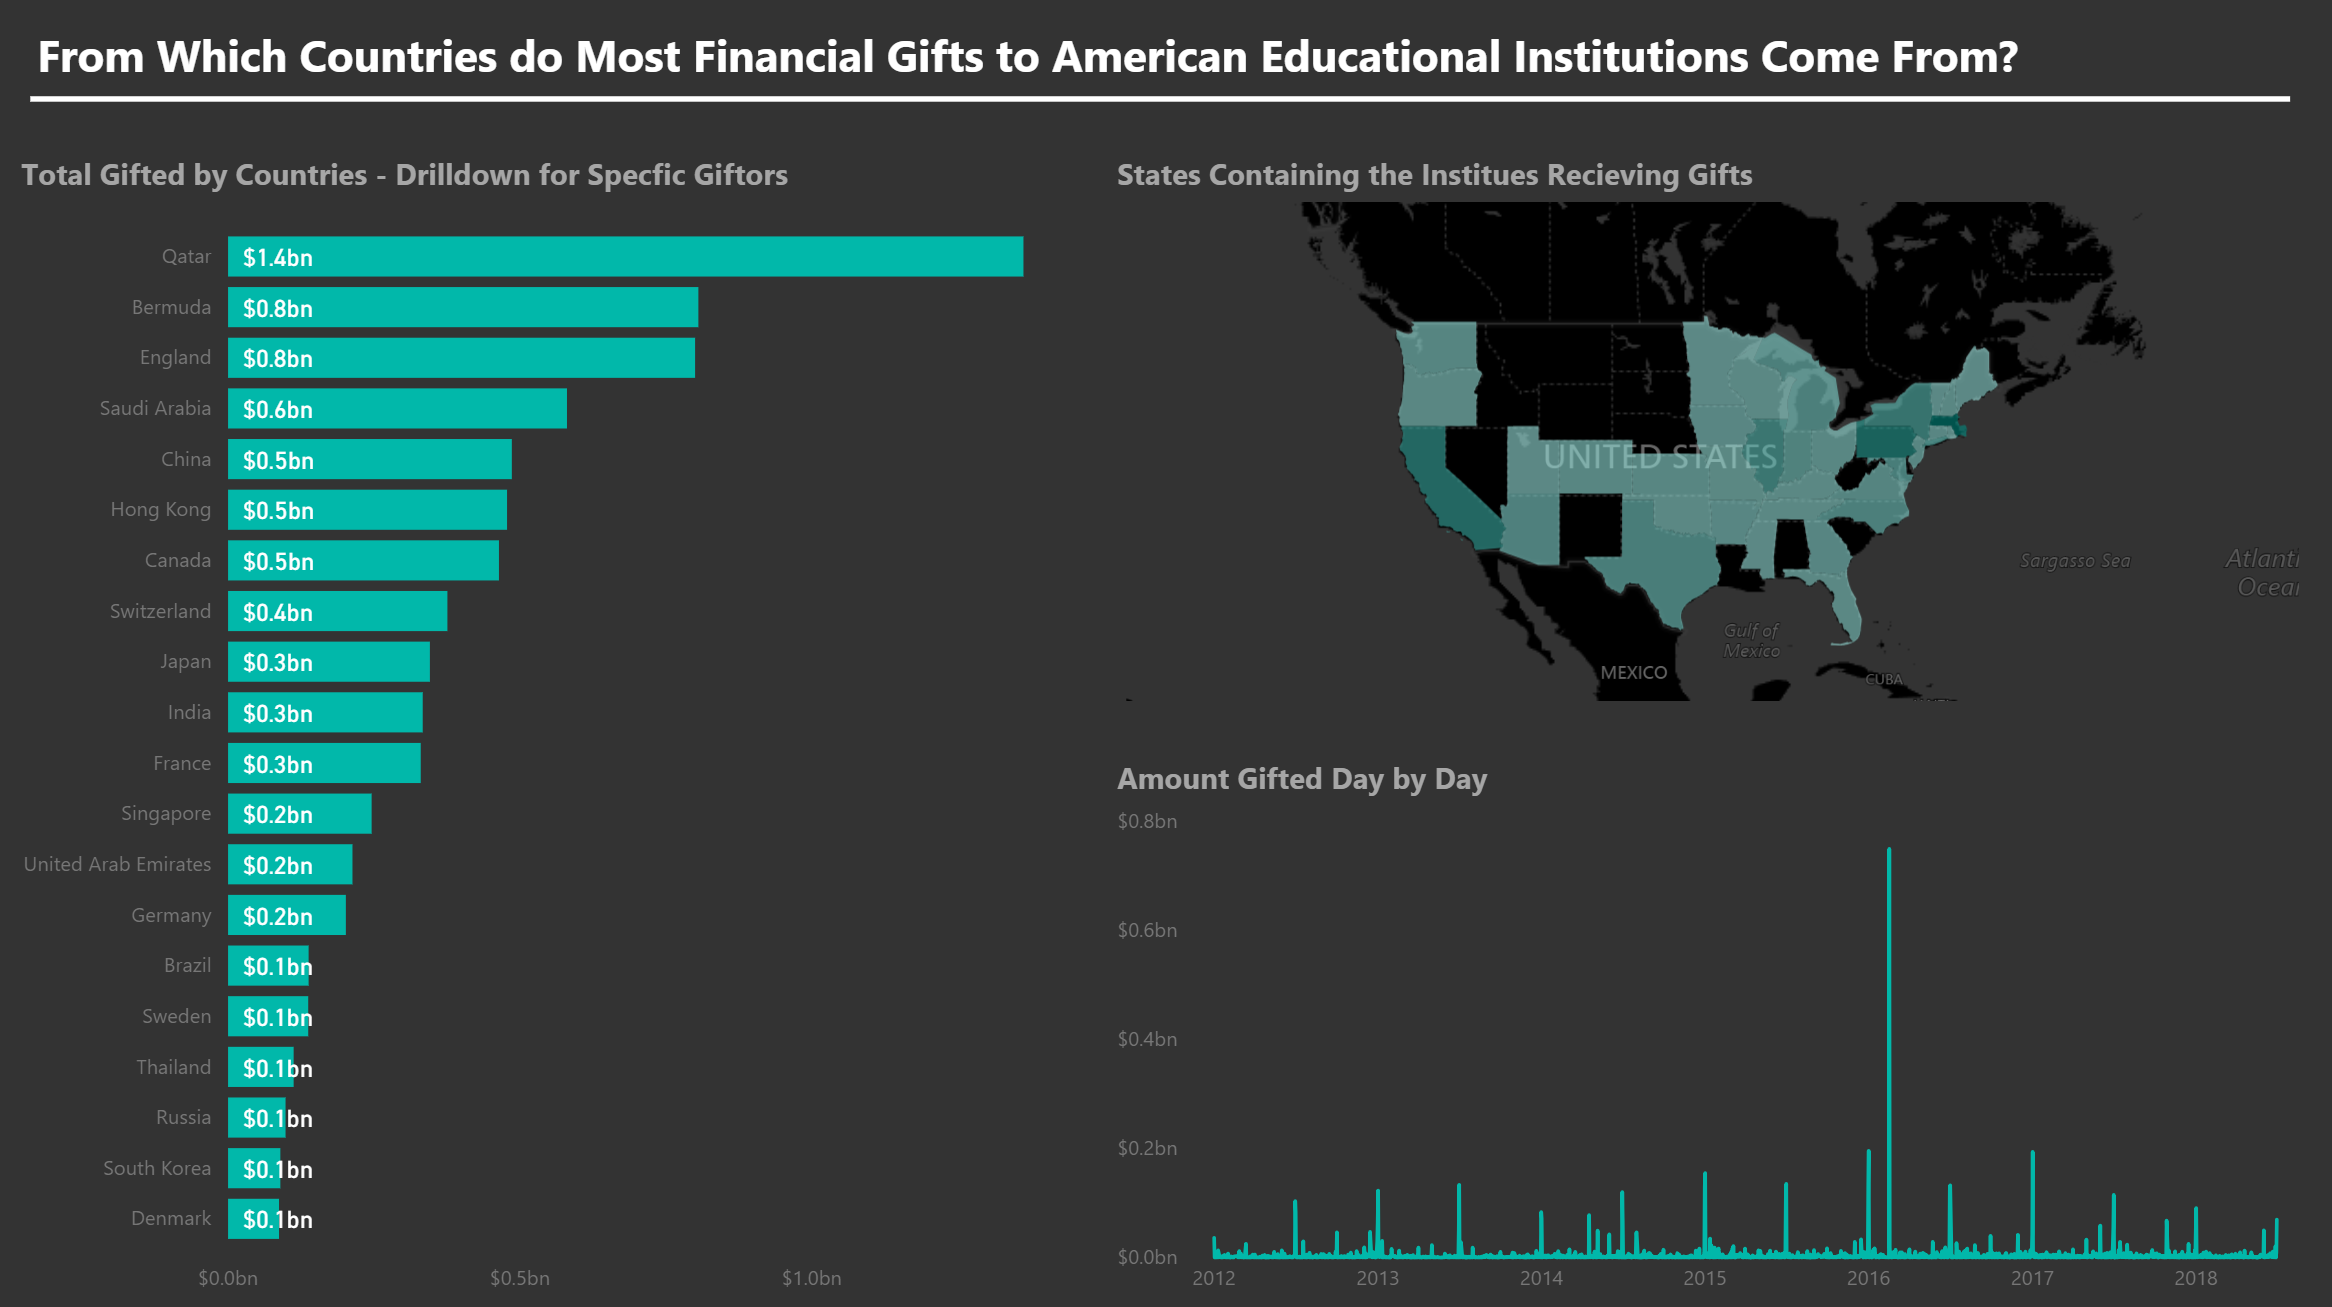
Initial Dashboard.
I added the ability to drill through on the country bars to a separate sheet which will then be filtered down to this country. This again was extremely easy and quick to set up, and adds a lot of value when it comes to reporting dashboards. The sheet which I drilled through to was made to focus on the specific institutions that had received gifts from the country being focused on. It included big numbers to give an overview for the country, an aggregated spend over time line chart which could be drilled down from year to quarter etc, and the amount given to each institution. Again these charts were all interactive with each other with the bar chart being most useful for filtering down the line and big numbers.
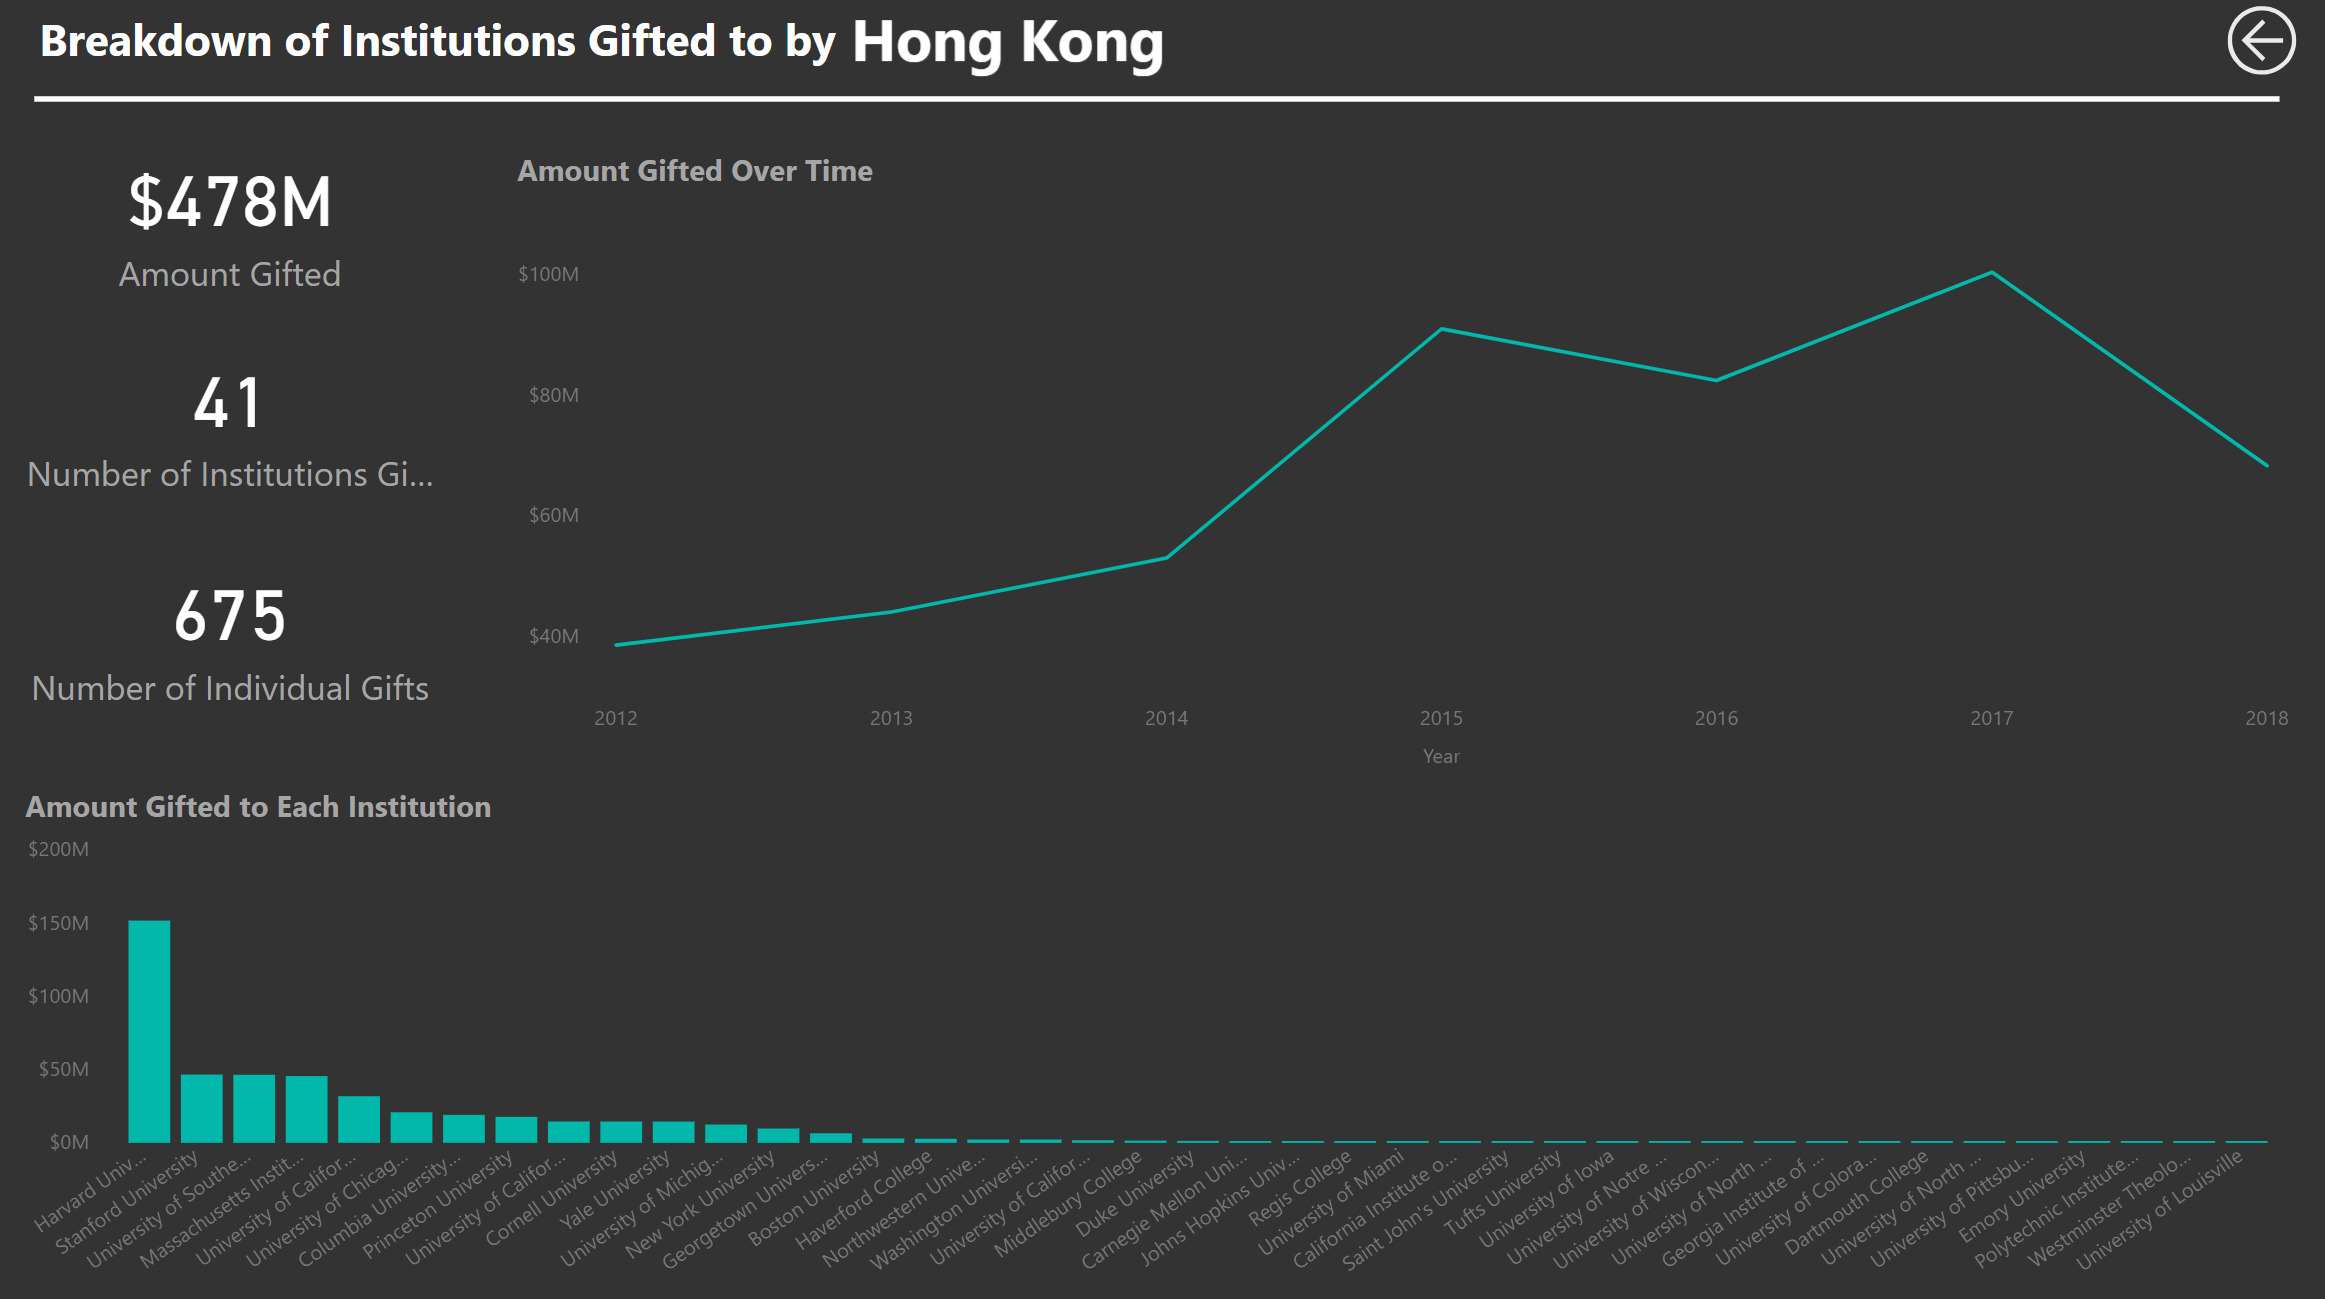
Drilled through dashboard.
Altogether I found Power BI very easy to pick up and use and found the design of the charts to be very clean and visually appealing. I also liked the fact that every sheet was essentially a dashboard, and so different chart types could be dragged on, easily moved around and altered etc. This allowed me to play around with different layouts and design types quite easily. I think it is a great tool for building report type dashboards especially if you know what you want to build beforehand. It does lack however when it comes to the freedom to explore the data in different ways and customise each chart in a very detailed way. This more standardised feel Power BI offers is likely perfect for many business scenarios but I personally enjoy the freedom to create more unique or stylised charts. Overall I enjoyed using Power BI and will definitely use it again in the future and try to develop my skills in it further.
Find my completed dashboard here.