


For Dashboard week day 5 we were given a dataset on boy bands. The data contained the highest charting single, dated when it charted highest, for every boy band. It also contained information about every boy band member such as height, hair style and hair colour. We only had until 1 o’clock so the time pressure was greater than normal. Seeing there was data on whether band member had frosted tips I wanted this to be the focus of my viz. Unfortunately however I was surprised to find that the donning of frosted tips didn’t seem to influence the success of a band, so I instead decided to explore the data for an angle to take that would be quick and easy to produce.
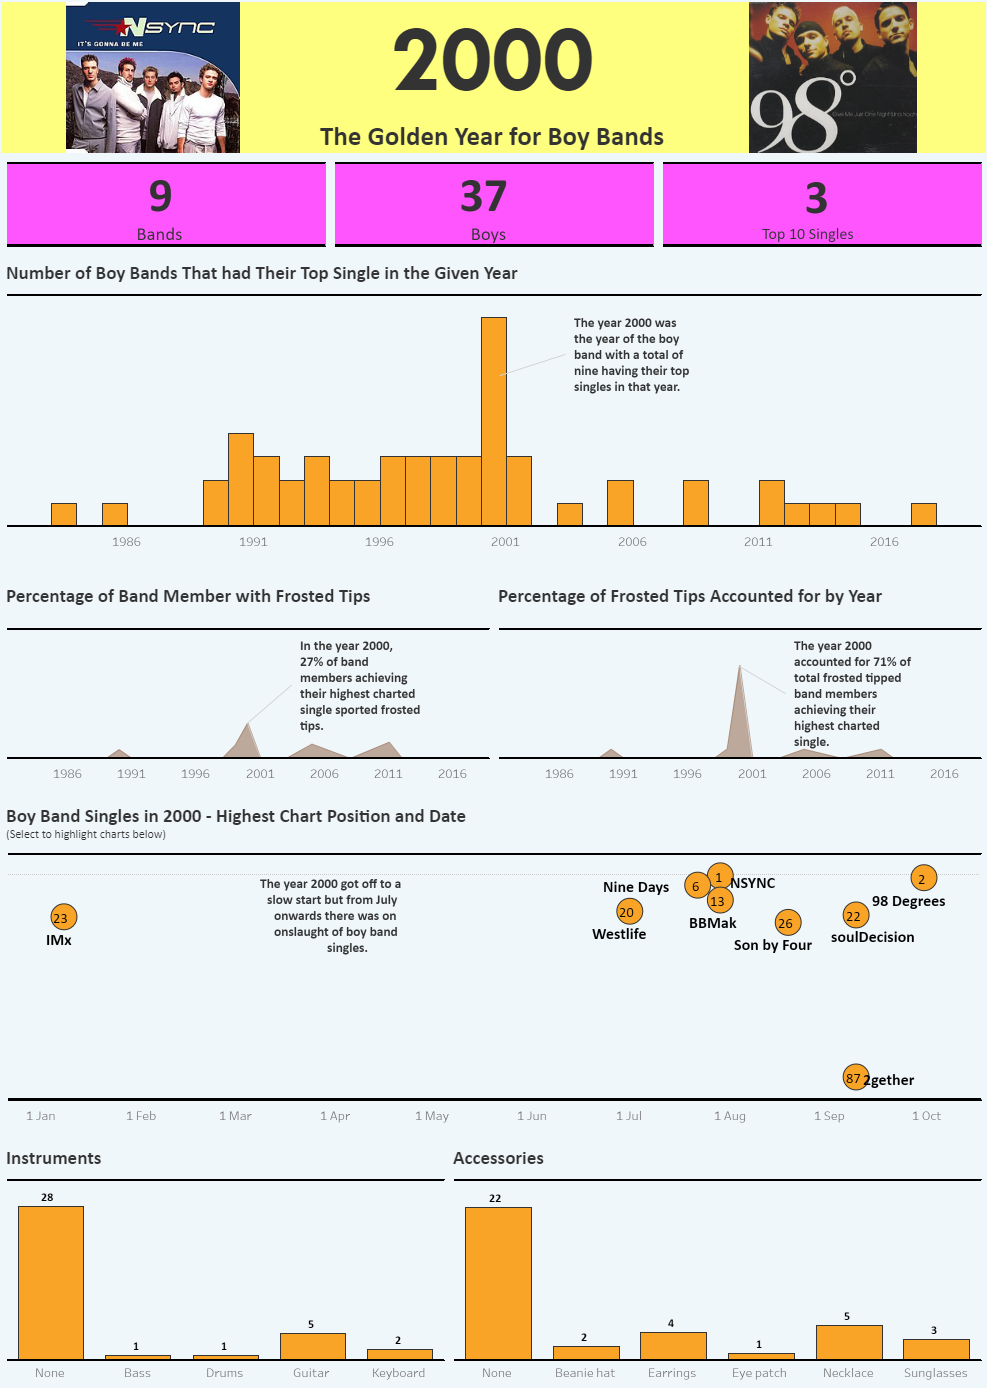
I quickly found that the year 2000 was the year which had the highest number of bands having their highest charting single and so I decided to focus on 2000 as the golden year of the boy band. I made a bar chart emphasising the year 2000 as the most successful boy band year.
My frosted tip exploration also yielded the finding that 2000 saw the highest percentage of boy band member having frosted tips. I visualised this using a brown area chart with yellow borders in an effort to make the chart in some resemble the subject matter.
Visualising when each band charted highest resulted in the finding that only 1 of the 9 bands charting highest that year did so in the first half of the year. I added this to the dashboard with the additional information of what chart position the single reached and the band name as the label.
Running out of ideas and time I decided to make bar charts looking into the numbers of band member with each “accessory” and was surprised to find that in the year 2000 there was one boy band member sporting an eye patch. I made the same chart but looking at instruments played instead of accessories. I decided to add some interactivity to the dashboard, making the time to position of each highest charting single proportionately highlight the bars when selected.
And so my final dashboard of dashboard week was completed. It was not my proudest piece of work, but I did enjoy making it and was relieved for the week to be over. All in all I enjoyed the challenge of dashboard week and was glad to be able to finish it on such a light hearted topic.
Find my viz here.