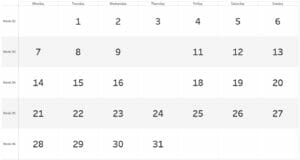
During Head Coach Andy Kriebel’s Tableau Zen Master Tips & Tricks – Chart Edition webinar he showed it was possible to make a calendar in Tableau. Today he showed is how to do it again and I will explain how/give some example uses here.
To make the calendar first right-click and drag the date dimension to the columns shelf and choose weekday. This should put Monday-Sunday across the top. Then right-click and drag the date dimension to the rows shelf and choose week number. This will put all the weeks of the year down the left hand side. Then right-click and drag the date dimension to the filter shelf and choose month / year. Select a single month and show the filter. The filter on the right hand side can then be set to only allow one month to be shown at a time by choosing either single value (list), single value (dropdown) or single value (slider). The date dimension can then be right-click dragged onto the labels shelf on the marks card and day chosen to give each day of the month in its corresponding weekday and week number. This date can then be formatted as a label to make the text bigger or a different font etc. It could also be useful to either have the day label as a small font aligned to the top right or as a large font aligned centrally to give more of a calendar aesthetic. Formatting the worksheet to include gridlines and borders and removing unnecessary headers also gives more of a calendar look.
This should result in a calendar, but be aware only dates which have data will show, so this viz type may not be suitable for datasets which don’t have daily data.

Data missing on Thursday 10th and 17th.
The calendar could be used to check for any weekly patterns within each month by instead of displaying the date as the label using some kind of measure. Profit, for example, could instead be used on the colour shelf of the marks card. This will then work like a heatmap showing which days are most and least profitable, and a diverging colour palette can be utilised to show which days had negative profit. This could also be done whilst keeping the date on the labels shelf resulting in the day being coloured by the measure, something which could work well if colours are diverging to show positive or negative results (or any kind of relevant boolean). This would work best with the date centrally aligned in a large font, allowing easy comparison between days. This could be used to identify key dates where the measure was high or low. A measure can also be placed on the label shelf and the running total calculated using a table calculation which works across then down. This would allow people to quickly check the value of the measure on a given date.
The calendar visualisation is limited in usefulness but people do intuitively know how to use calendars and so when it comes to conveying simple messages it could come in handy.
To see a video of the calendar being made see this video (skip to 1:10:06).
