Tableau’s set actions allow you to make your dashboard or worksheet interactive. By hovering, clicking and generally interacting with the elements on a sheet colours, sizes marks and may more things can be influenced on both the same and other charts. Set actions provides functionality not previously available through filtering alone by dynamically changing the set membership of fields in a dimension. Below is a set of tasks you can use to help learn set actions. You can find the incomplete workbook to download here and the completed workbook to check your answers here. There is also a step by step walkthrough of how to create the views here.
Set actions work by first creating a set and choosing its members. This set can then be placed somewhere to influence the view (colour, filters etc) or referenced by a calculation on the view. A set action can then be added via worksheet/dashboard actions in which the sheet and the set are referenced so that hovering, selecting or selecting using the menu changes the membership of the set to the part interacted with. The set membership can then be set to stay the same, include all parts or include no parts after completion of the interaction.
You can attempt to recreate the views below by yourself or download the completed workbook to see how they work.
Proportional Highlighting
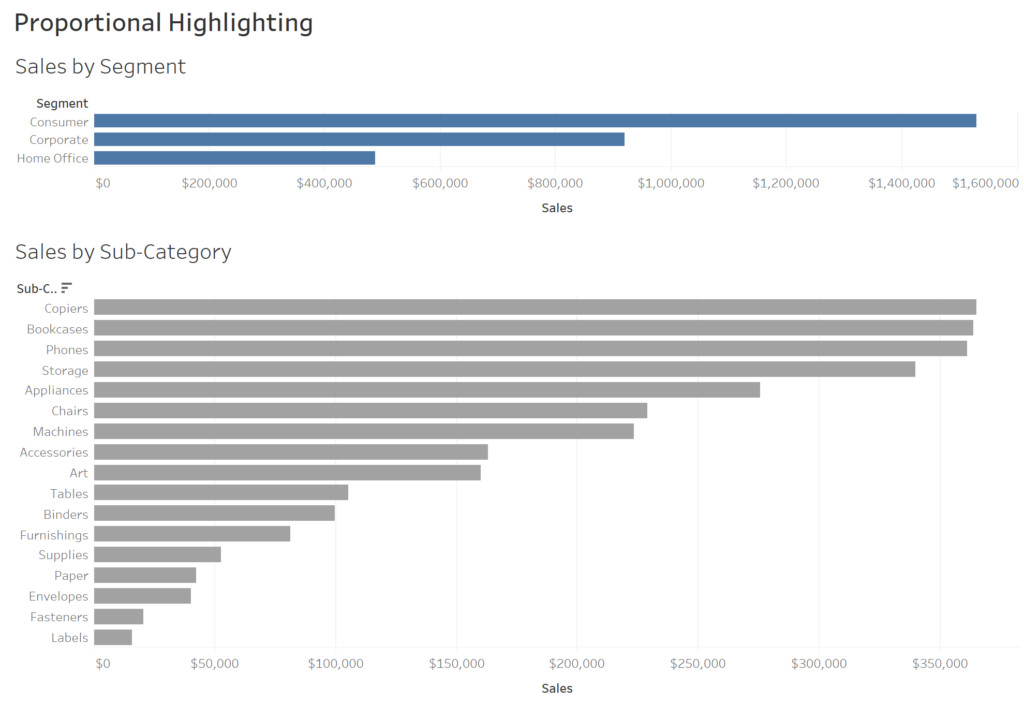
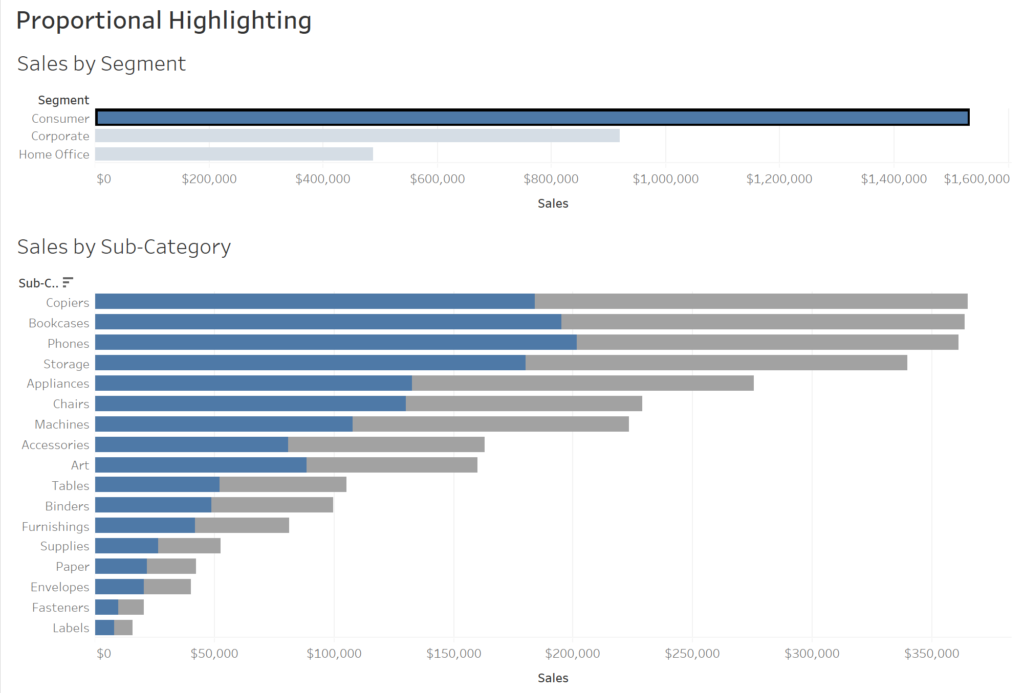
This view requires two sheets which are linked via set actions. Selecting a segment in the top bar chart will colour the sub-category bars below to the proportion represented by the selected segment.
Asymmetric Drilldown

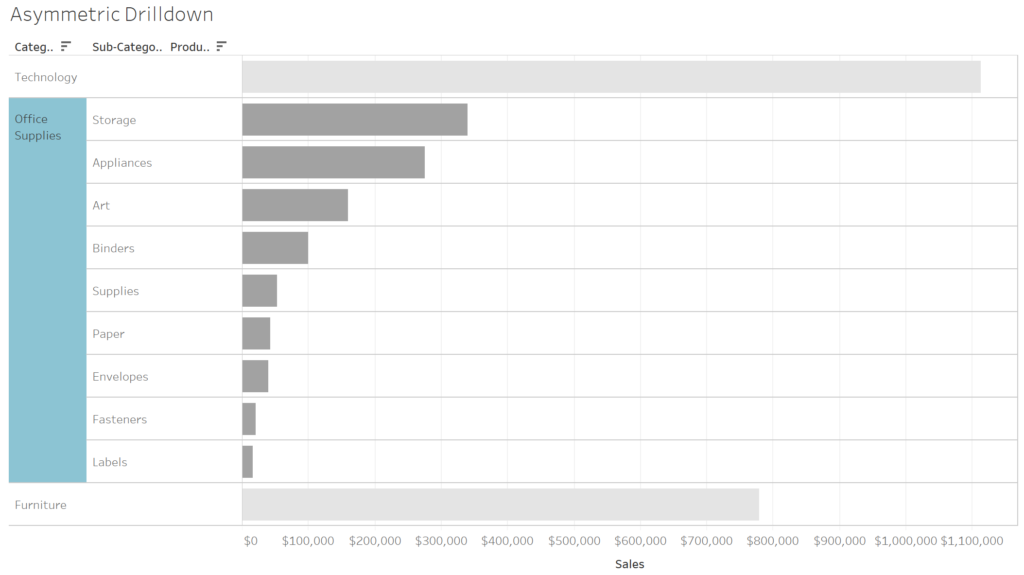
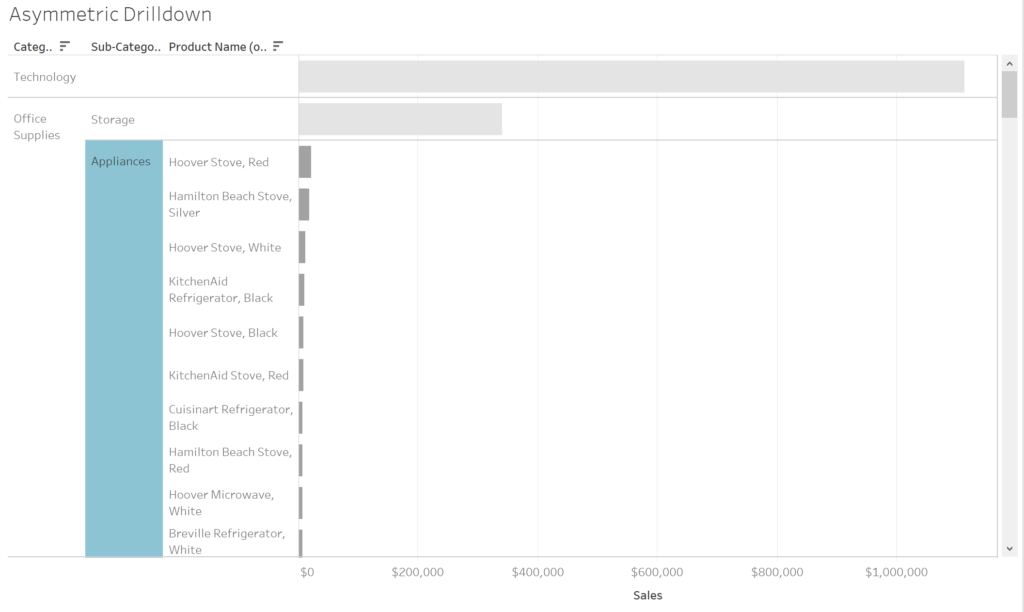
Selecting a category will give a menu with options to drilldown to sub-category and product name. Selecting one of these options will drill down to sub-category’s or product names within the selected category only. There will be the option to drill from sub-category to product name.
Colour Scaling
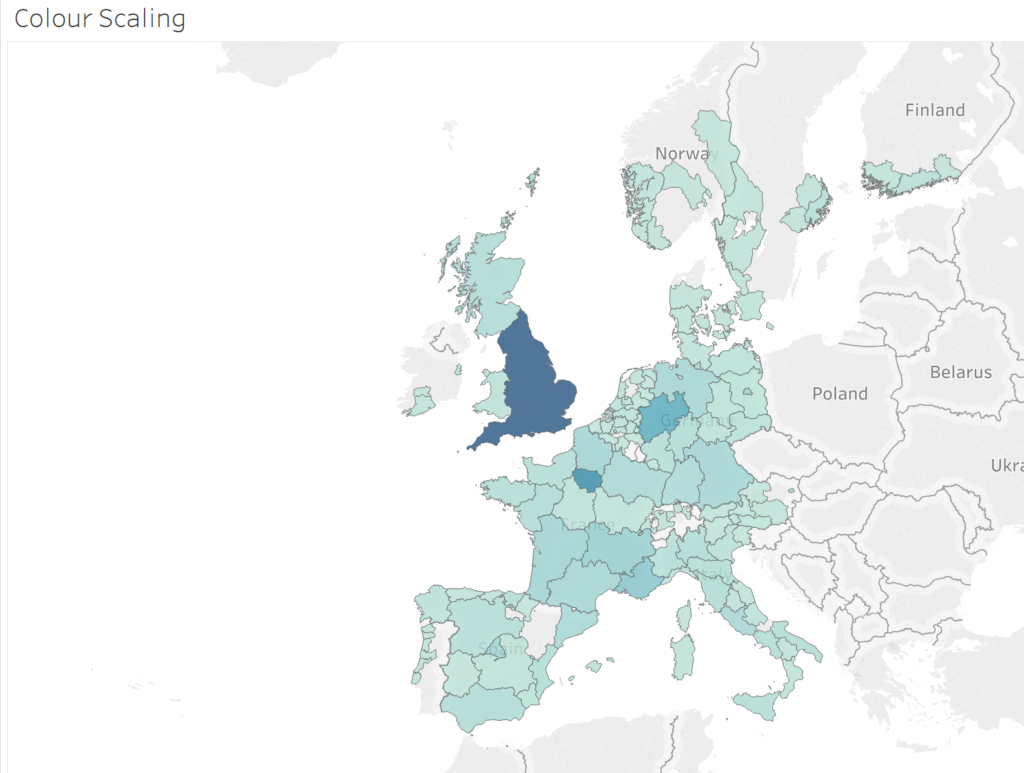
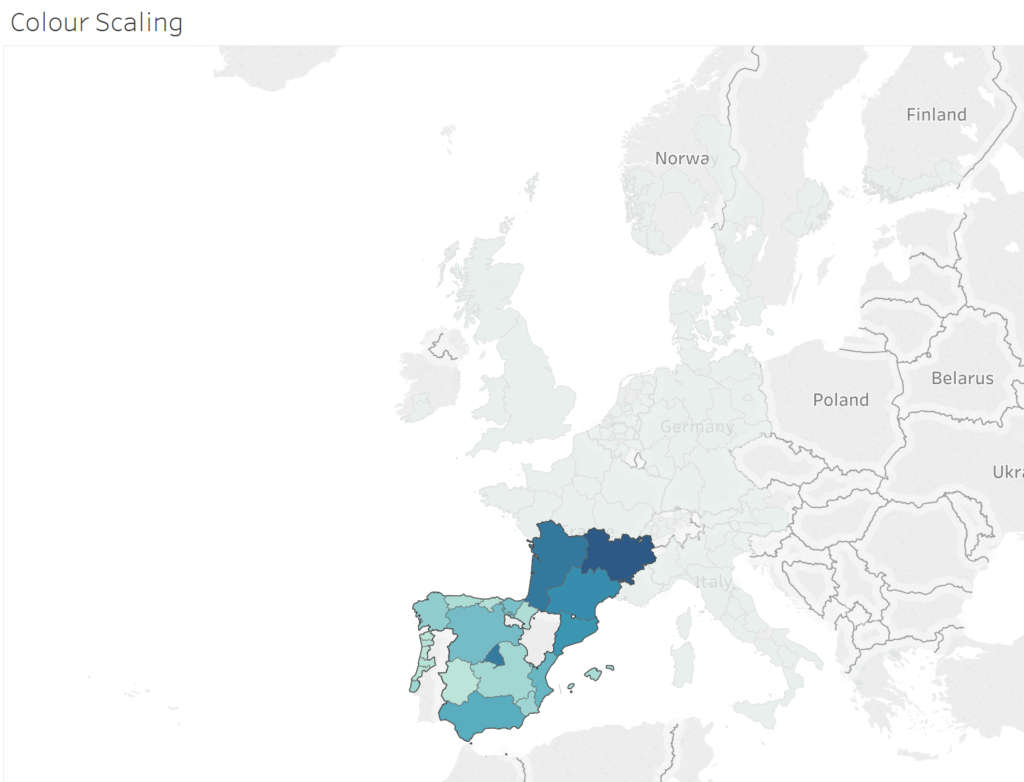
Selecting states will cause them to recolour based on only the sales values for states selected. None-selected states will be faded out – the colour scale will be for selected states only.
Replace Tooltip with In Set Highlighting
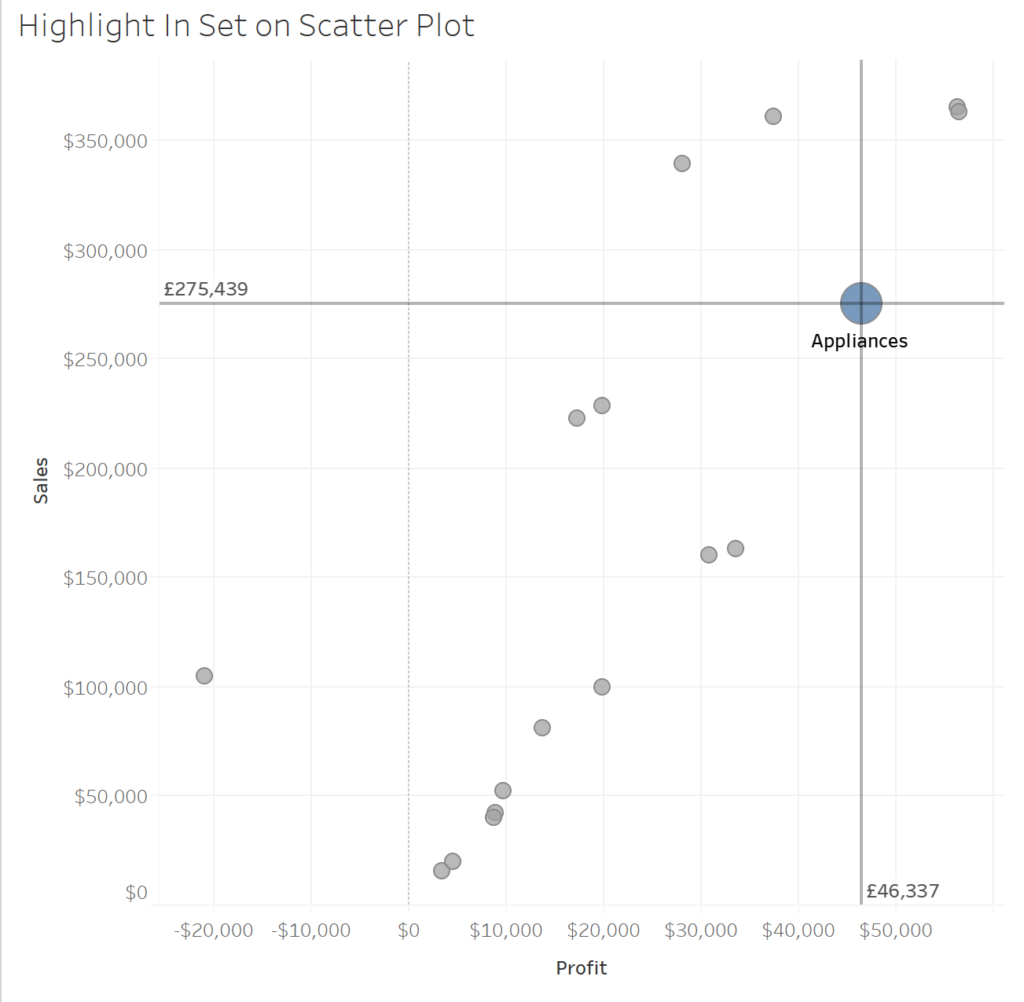
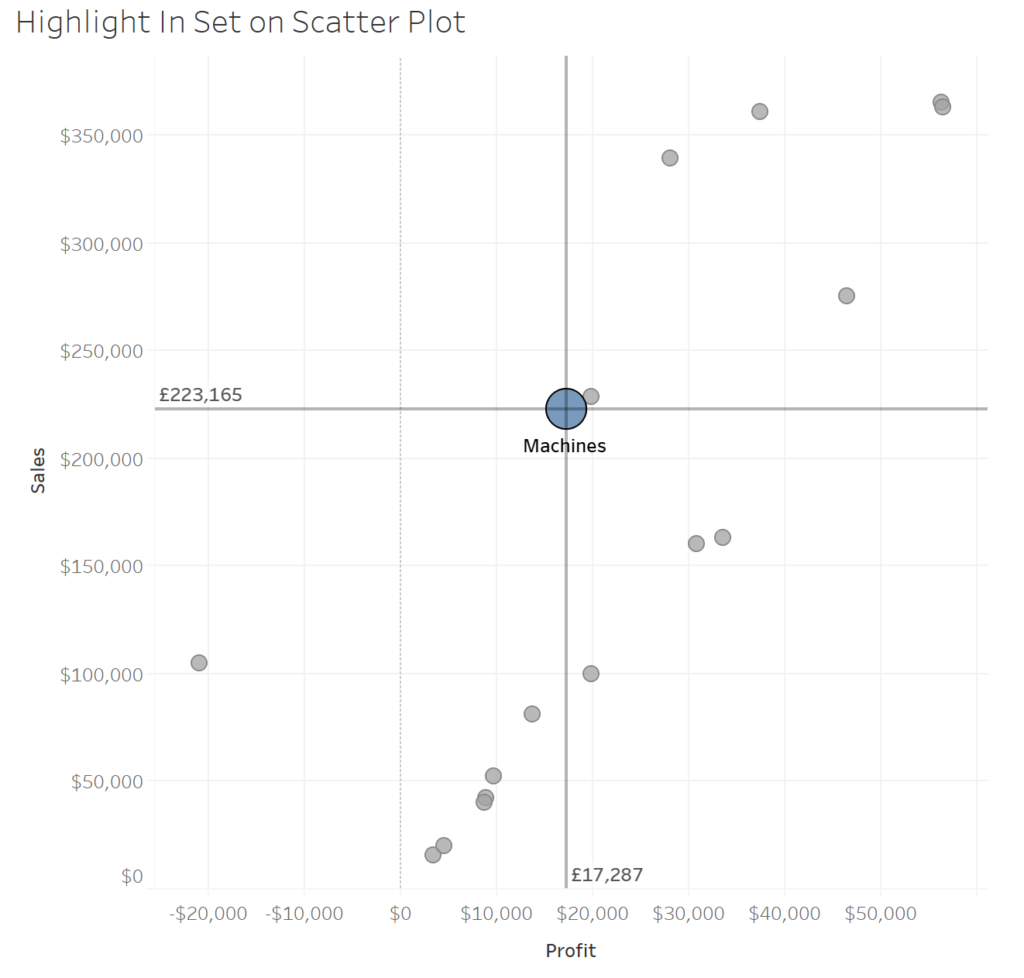
On a scatter plot of sales against profit, hovering over any sub-category mark will cause it to change size and colour and be labelled. Reference lines with sales and profit value will show for the highlighted sub-category mark.
Proportionally Highlight Viz in Tooltip
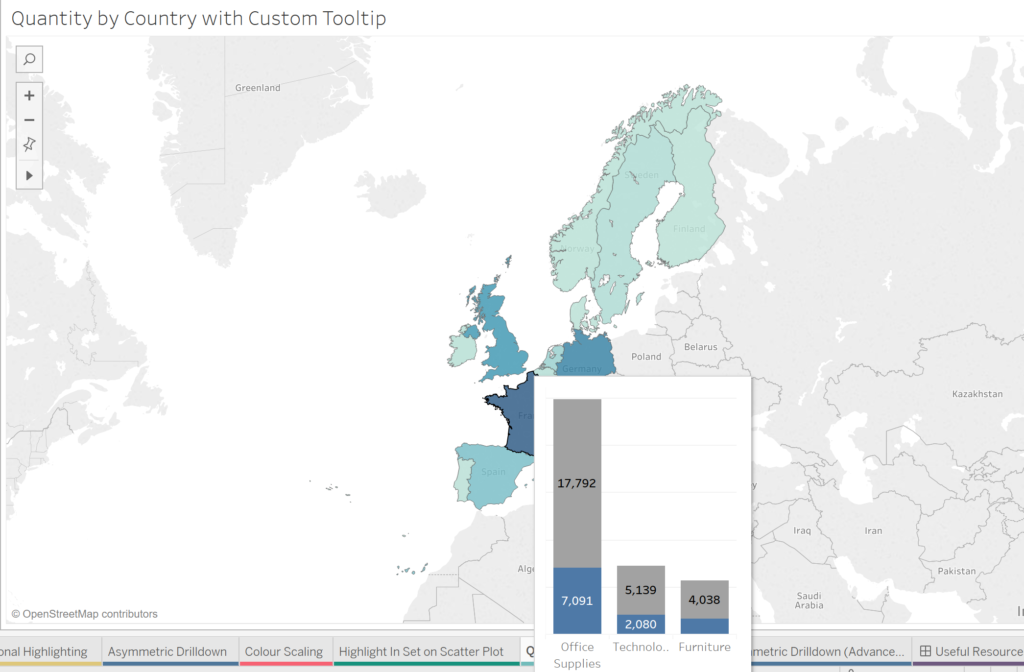
Hovering over a country will show a tooltip which displays a bar chart showing total quantity sold in each category. The bars will be proportionally coloured for the quantity sold by the selected country.
Drilldown Using Levels
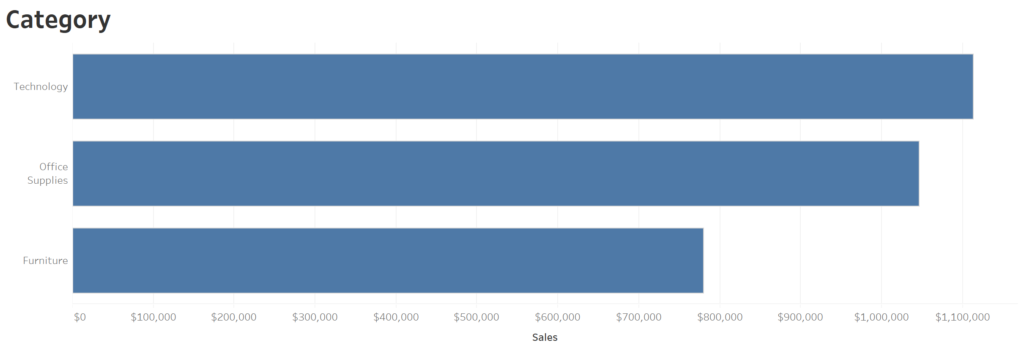
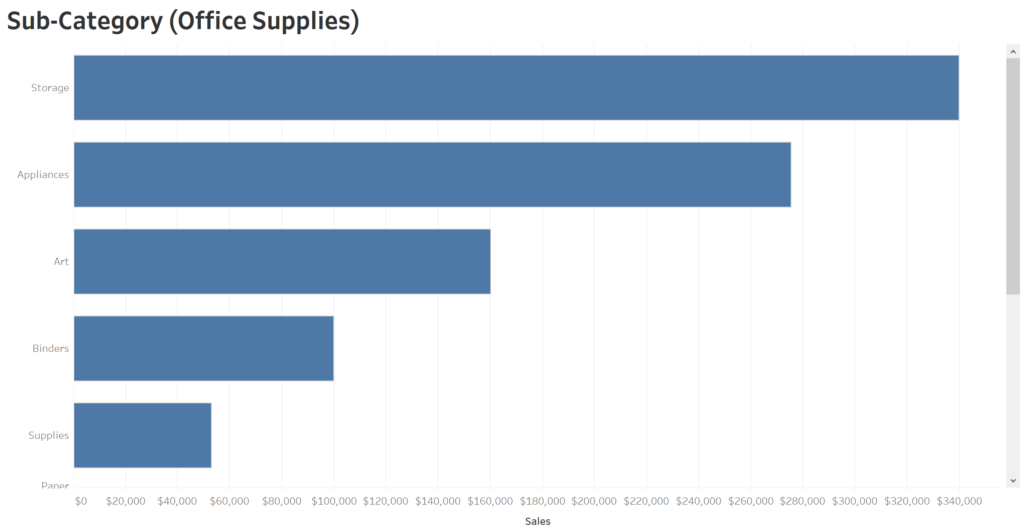
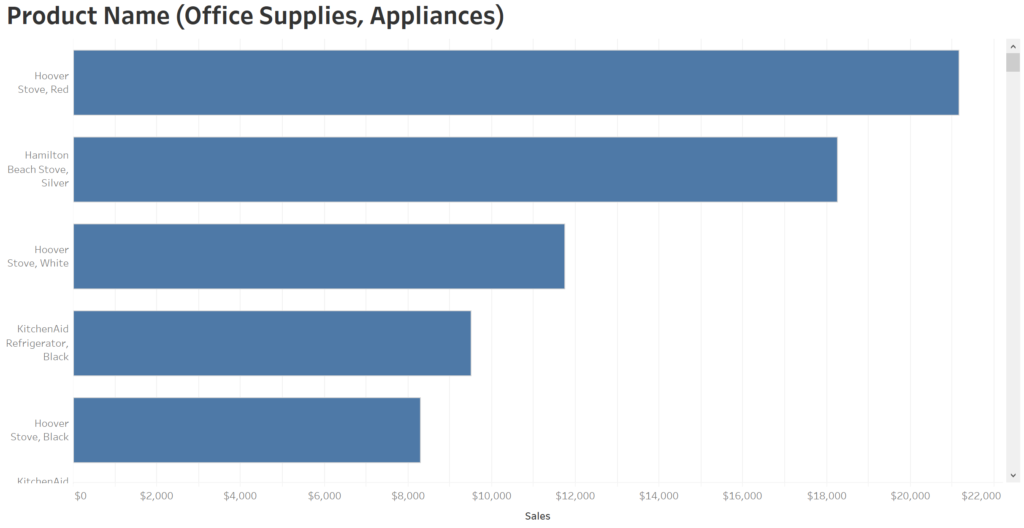
The chart will show category by sales. Selecting a category will drilldown to the sub-categories within that category only. The categories will no longer show. Selecting a sub-category will show the product names within that sub-category only and the sub-categories will no longer show. The title will give the level you are on and show in brackets what you have drilled down on.
I have a webinar in which I go through the above examples step by step and explain how they work. I will link it here once it’s uploaded. The final 3 tasks will use different data sources to Superstore and will combine the techniques used to create the previous dashboard/worksheets.
Proportionally Highlight and Drilldown
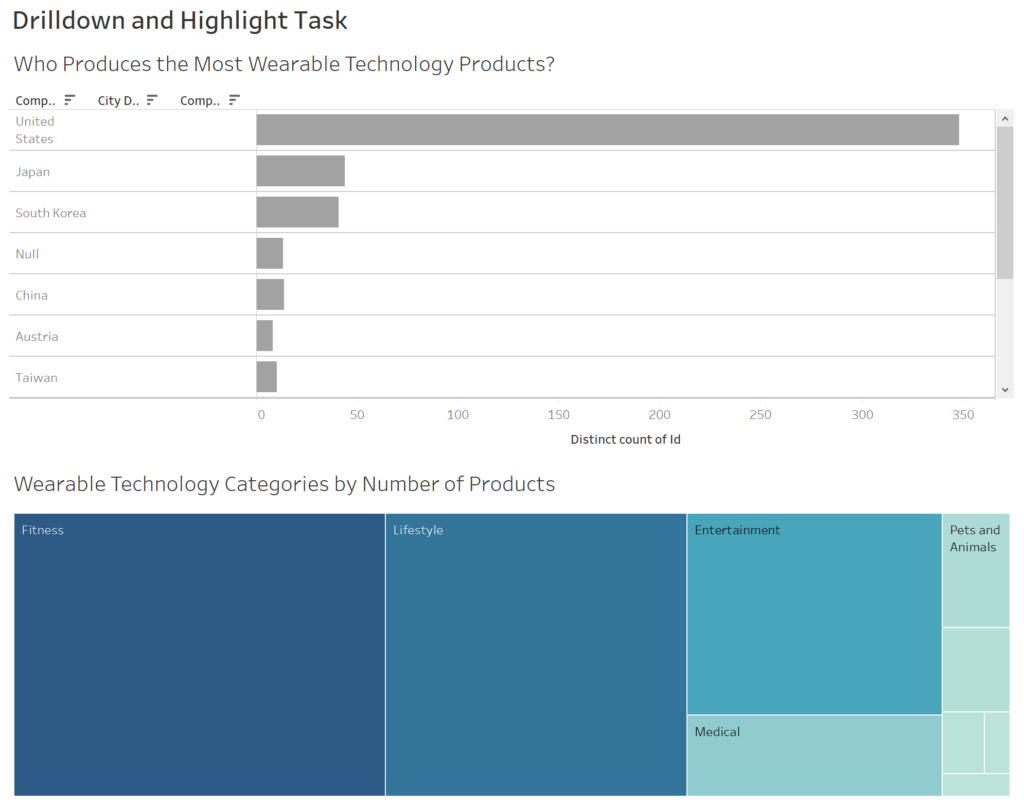
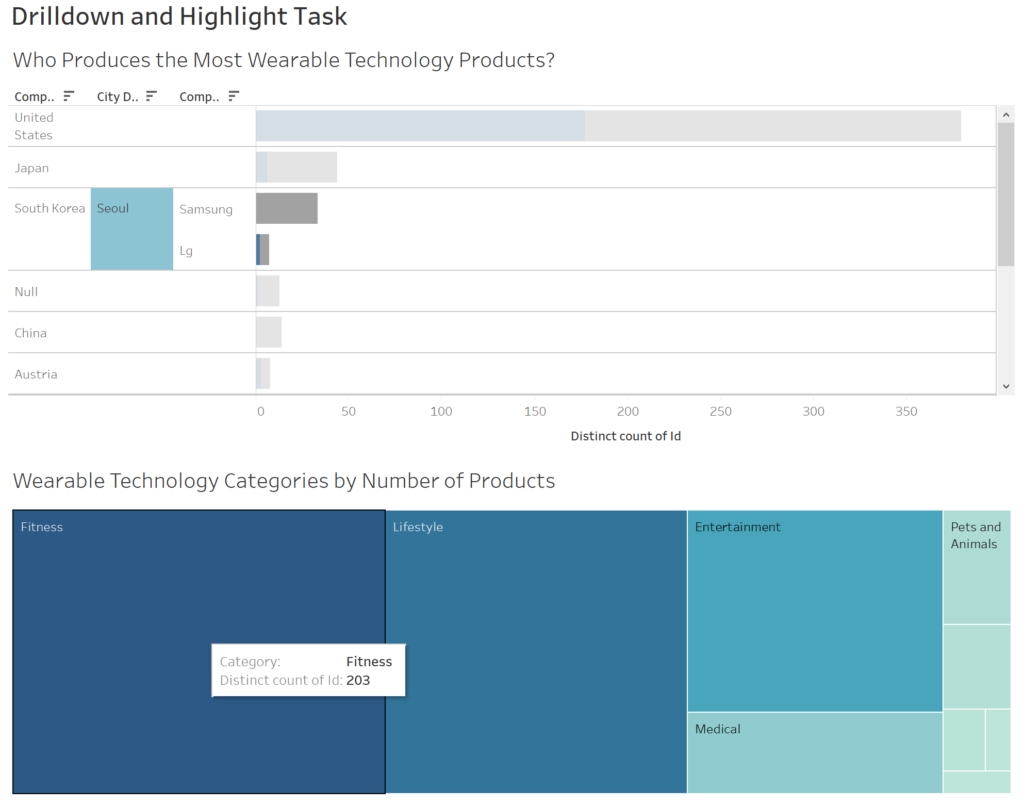
The bar chart will drill down from country to city and from city to company on select and the bars will represent the number of distinct products coming from that area/company. The treemap of categories will proportionally highlight the relevant category on the bar chart above so you can see the proportion of products from a country/city/company that are from each category.
Colour Scaling and Scatterplot Highlighting
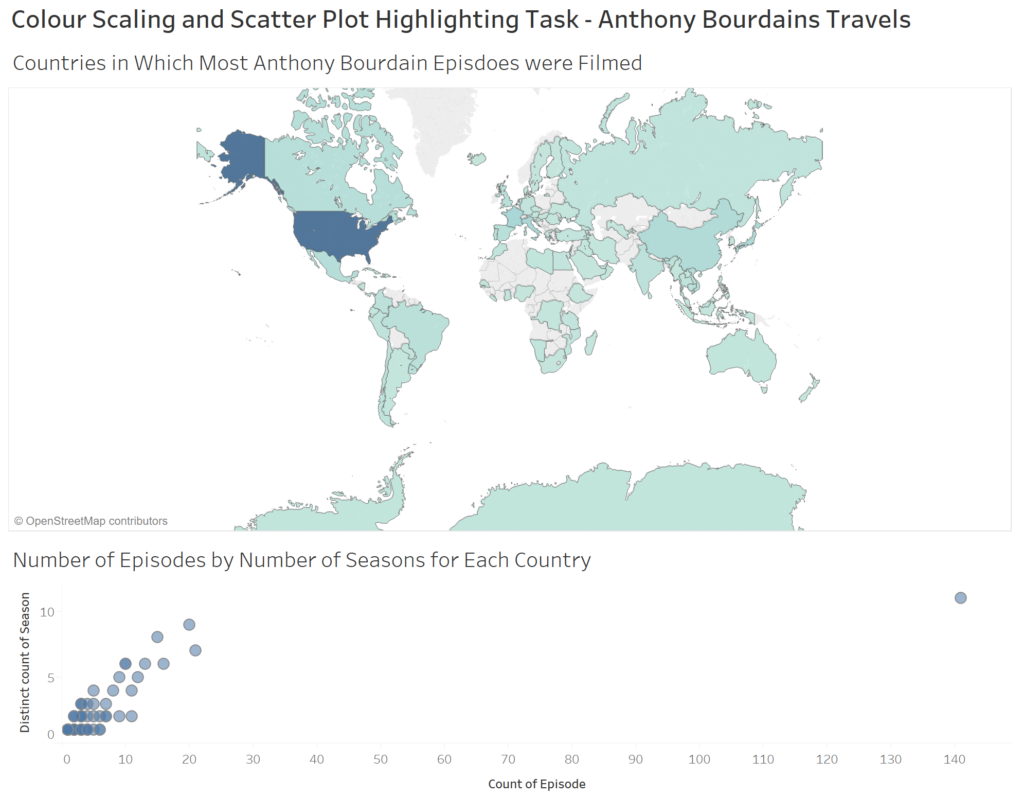
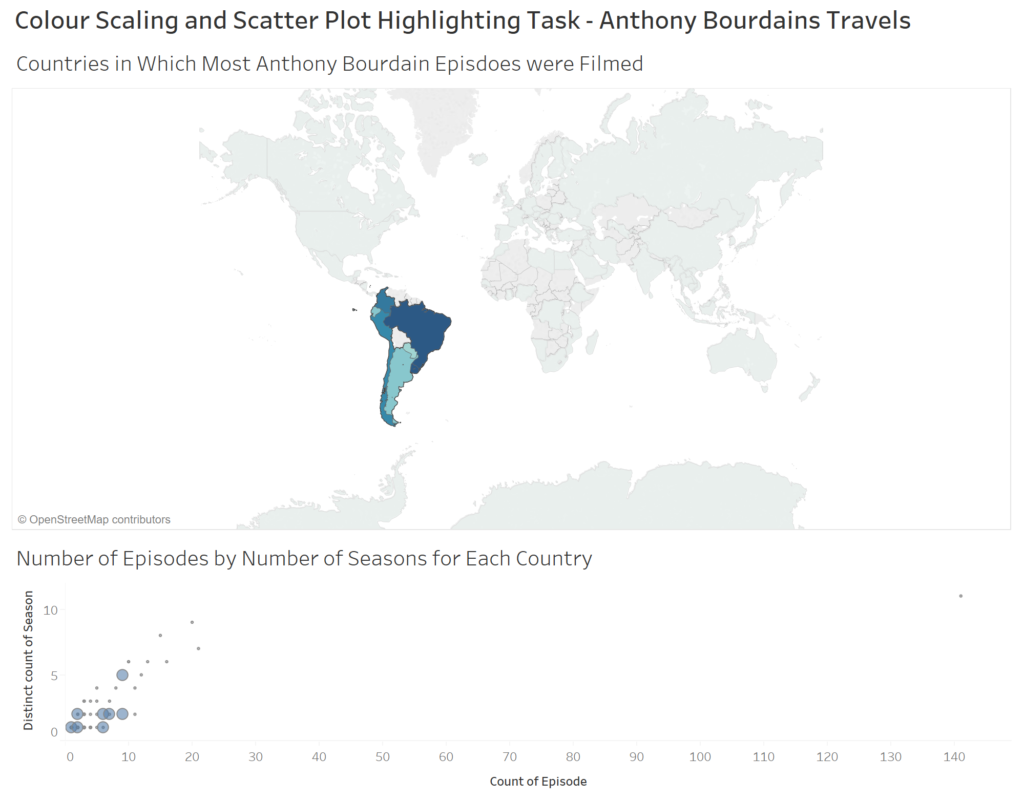
Selecting any countries on the map will cause the maps colour scale to only apply to them. The episodes vs seasons scatterplot will have all show large coloured marks but when selecting countries on the map all countries which aren’t selected will decrease in size and turn grey.
Fatalities Dashboard
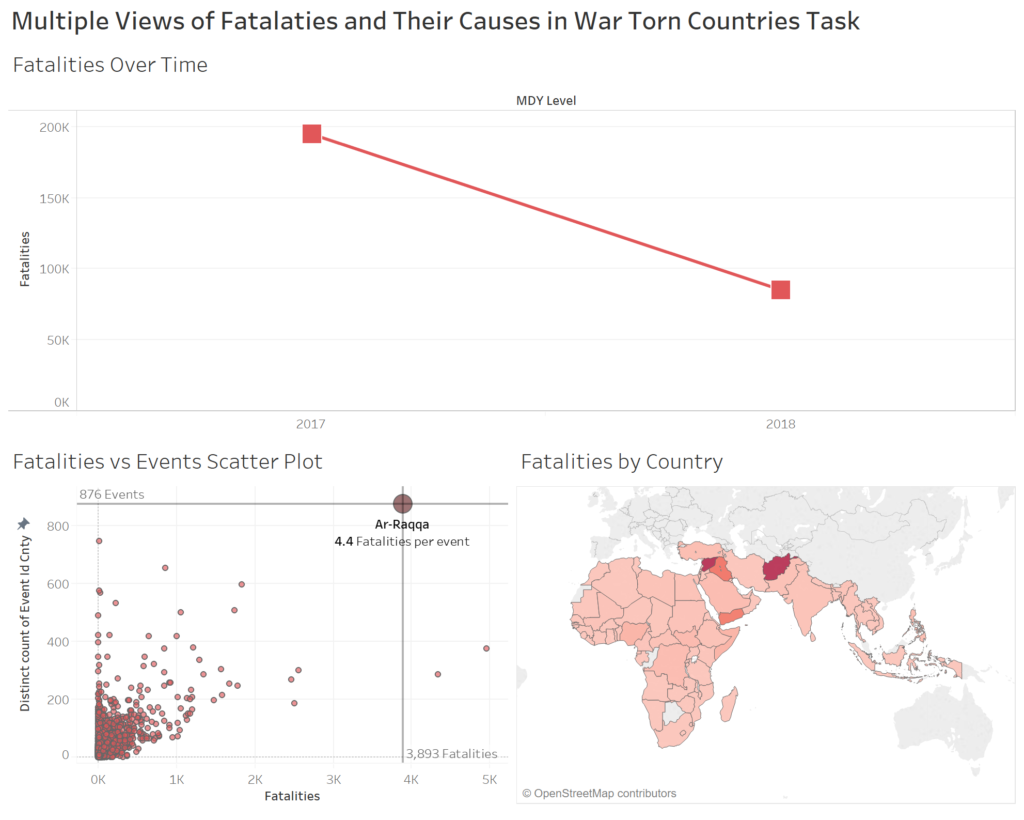
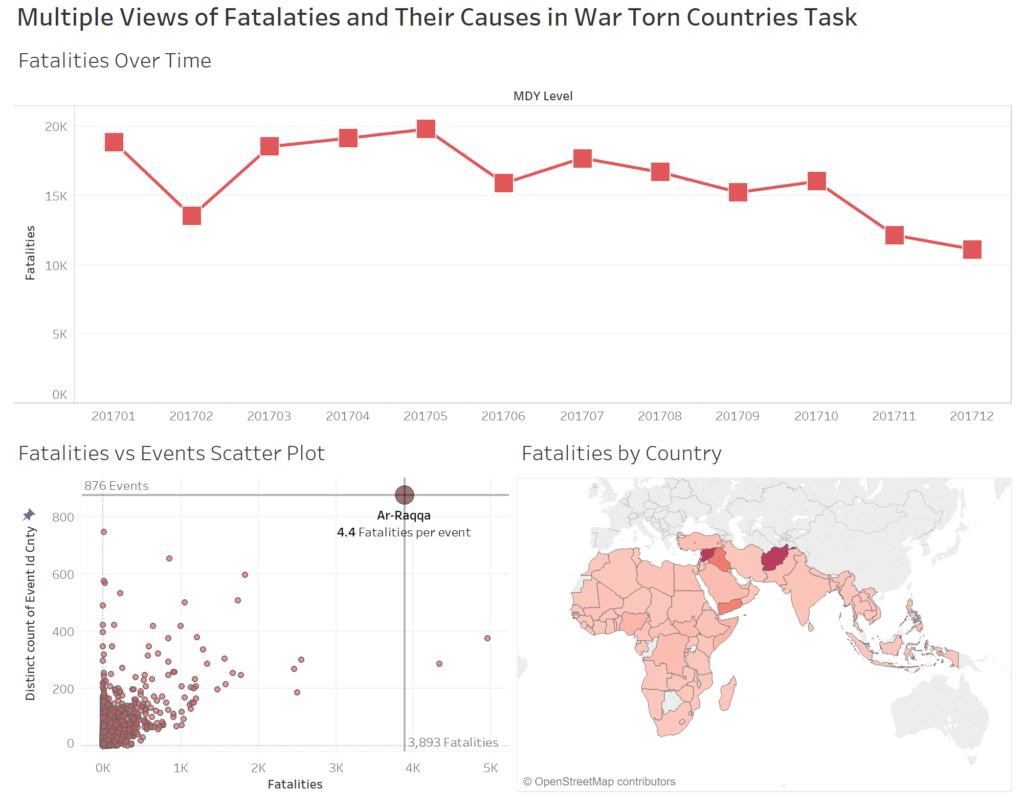
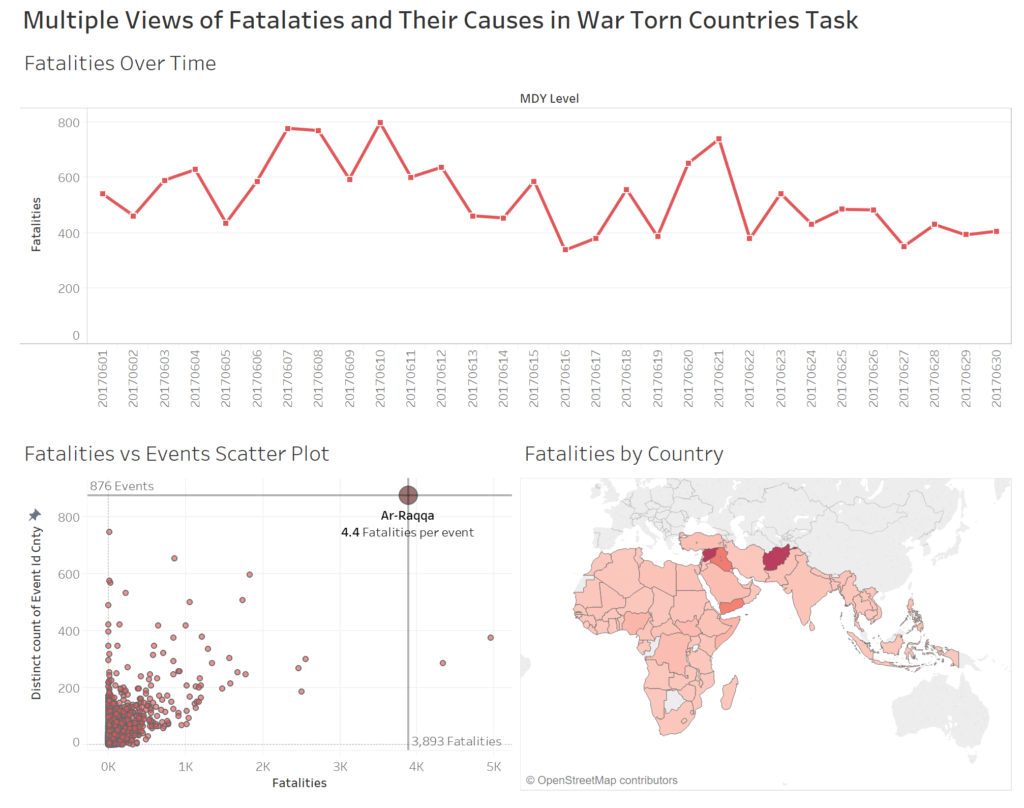
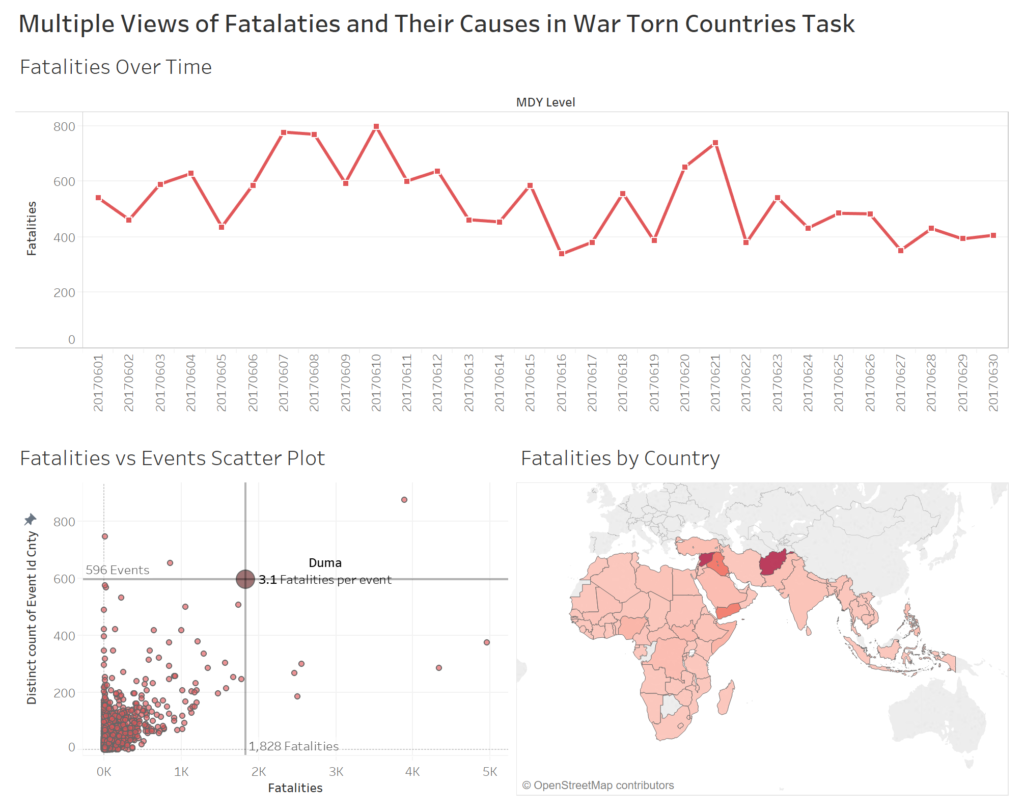
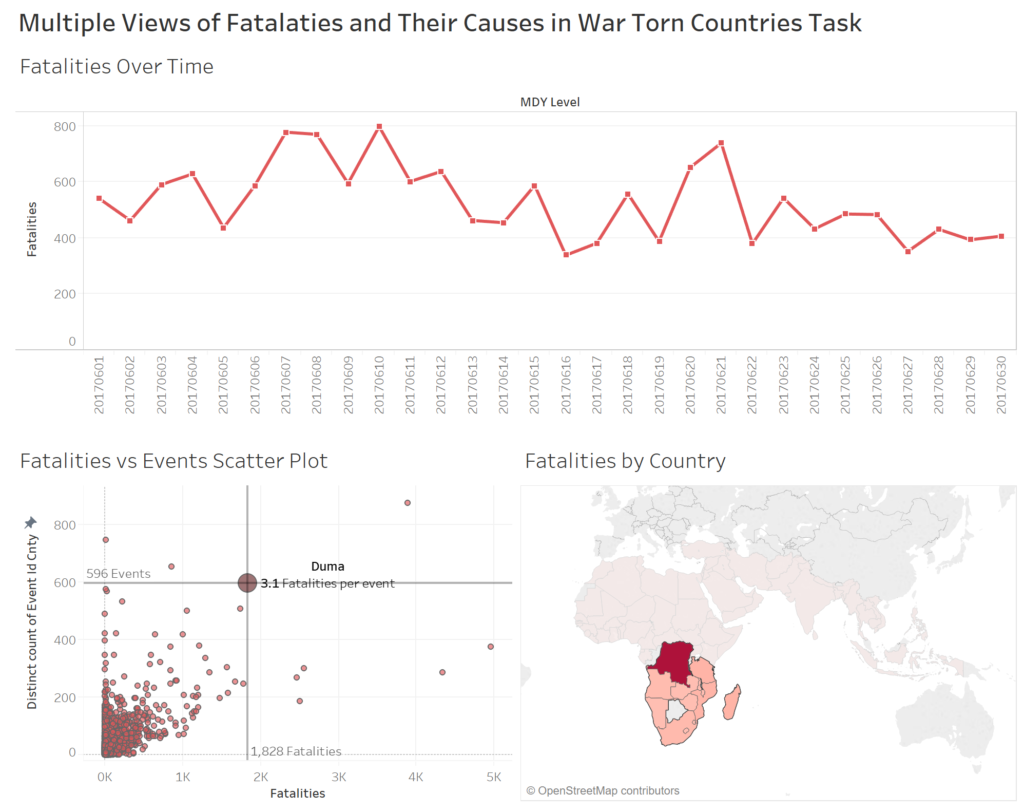
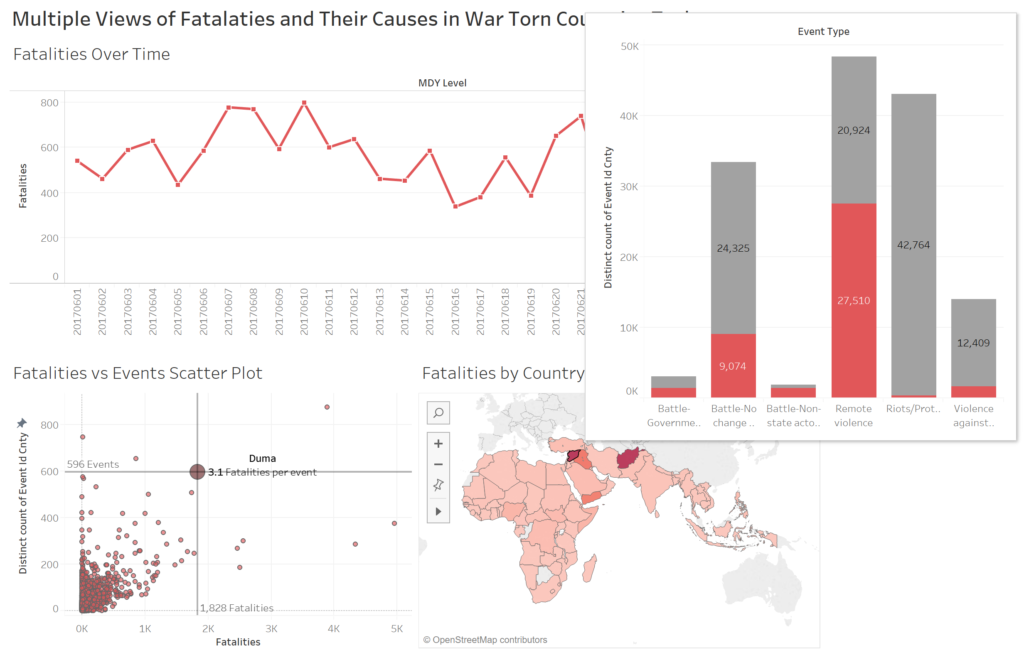
The final dashboard combines many of the methods used previously. The line chart shows fatalities for both years. Selecting on drills into that year and gives fatalities by month for that year. Selecting a specific month will show the fatalities by day for that month. For the number of events against fatalities scatter plot each city will be highlighted on hover with a larger and different coloured mark. The city name and fatalities per event will be shown as well as number of events and fatalities as reference lines. The colour of the map will be scaled by the selected countries and hovering over a country will show a tooltip which gives bars for the number of fatalities overall for each event type which is proportionally highlighted by the selected country.
To learn set actions and to make this workbook I used two main resources. The first is Tableau’s set action guide which I used to help create many of the tasks. It can be found here. The second was Lindsey Poulters set action workbook which I used for the more advanced techniques. It can be found here.
