Tableau LOD’s can be used to get the date of first purchase, first signed up, first order etc. This has many real world applications such as tracking percentage difference from this first date, looking at customer retention from first date and seeing how long it took/it has been for a product to be sold for the last time. The LOD to give the first date is structured { FIXED (any dimension to broken down by) : MIN(date) }.
Tracking percentage difference from first date
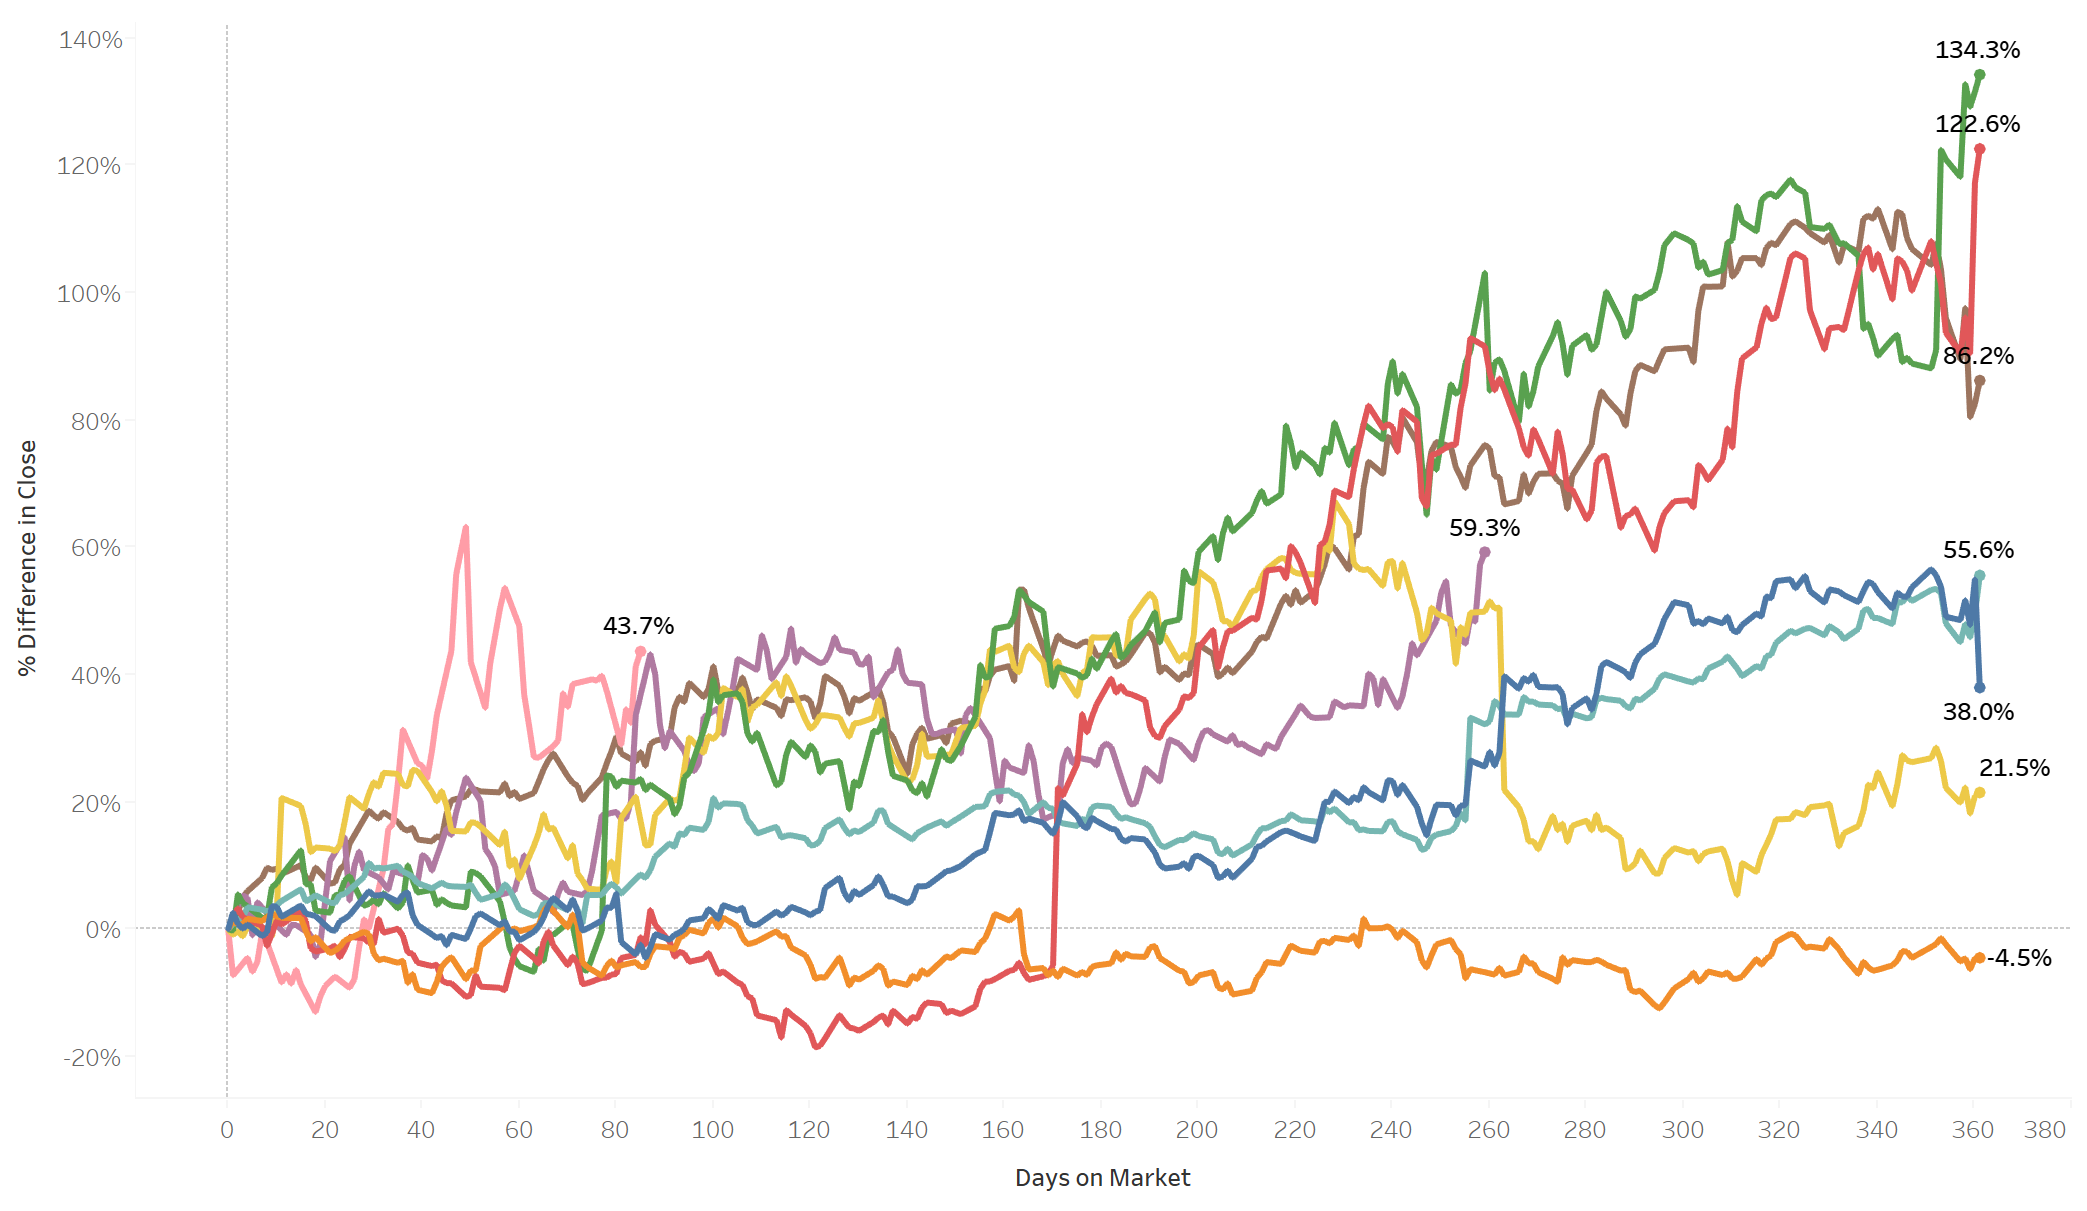
Tracking the percentage increase/decrease from first date can be useful to see how much a customer has purchased in the days since, to compare how a metric has improved/worsened since being measured or comparing the progress of different companies since their inception. I will use the final example here. To find the percentage difference in closing market value compared to a companies value on entering the market we must first calculate the first date (of market entry). To do this we use the following calculated field:
DATEDIFF(‘day’, {FIXED [Stock] : MIN([Date])}, [Date])
This calculates the difference in days between the first date and the current selected date. The first date is the LOD in the middle which gives the minimum date for each company (stock). This calculated field will now give a count of days from 0. We can put this on the Columns shelf and the closing market price field on Rows. The closing market price can then be made into a table calculation which finds the percentage difference from the first date for each company. The stock/company can then be put on colours to show individual lines for each company allowing for comparison between them.
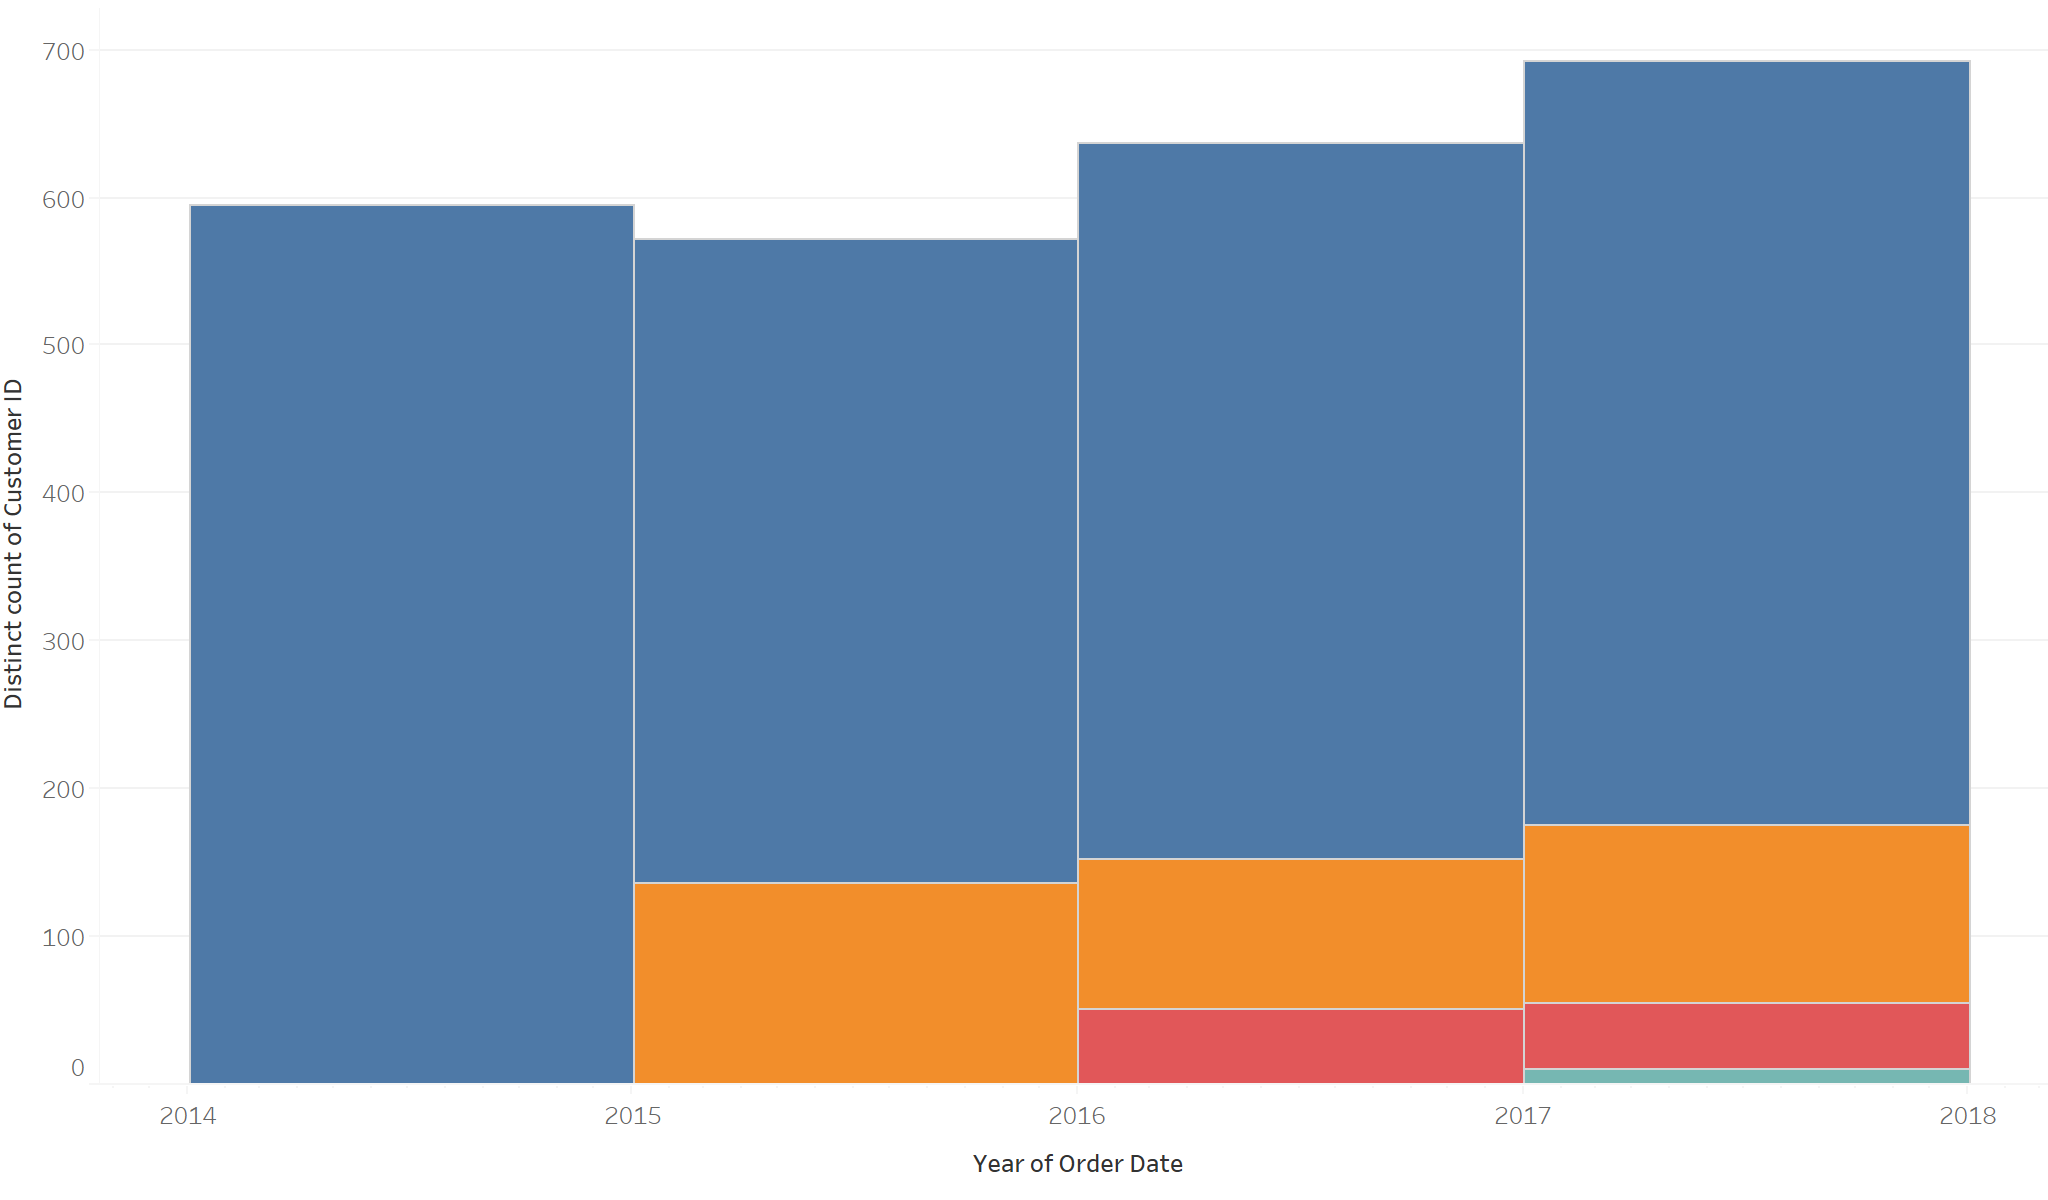
Customer retention from first order
Tracking customer retention from their first order is useful as it allows us to see how successful we are at keeping and gaining new customers over time. Again we need to calculate the first time a customer purchased with us and this is achieved by finding the date at which their ID first appears in the data set (making a purchase). The following LOD calculation achieves this:
{FIXED [Customer ID]: MIN([Order Date])}
The distinct count of customer ID can be plotted against year of order date to see number of customers purchasing over time. This can then be coloured by the calculated LOD above and changed to a bar chart. This now shows the proportion of customers by the year of their first purchase, and so shows the retention of customers as well as acquiring of new ones.
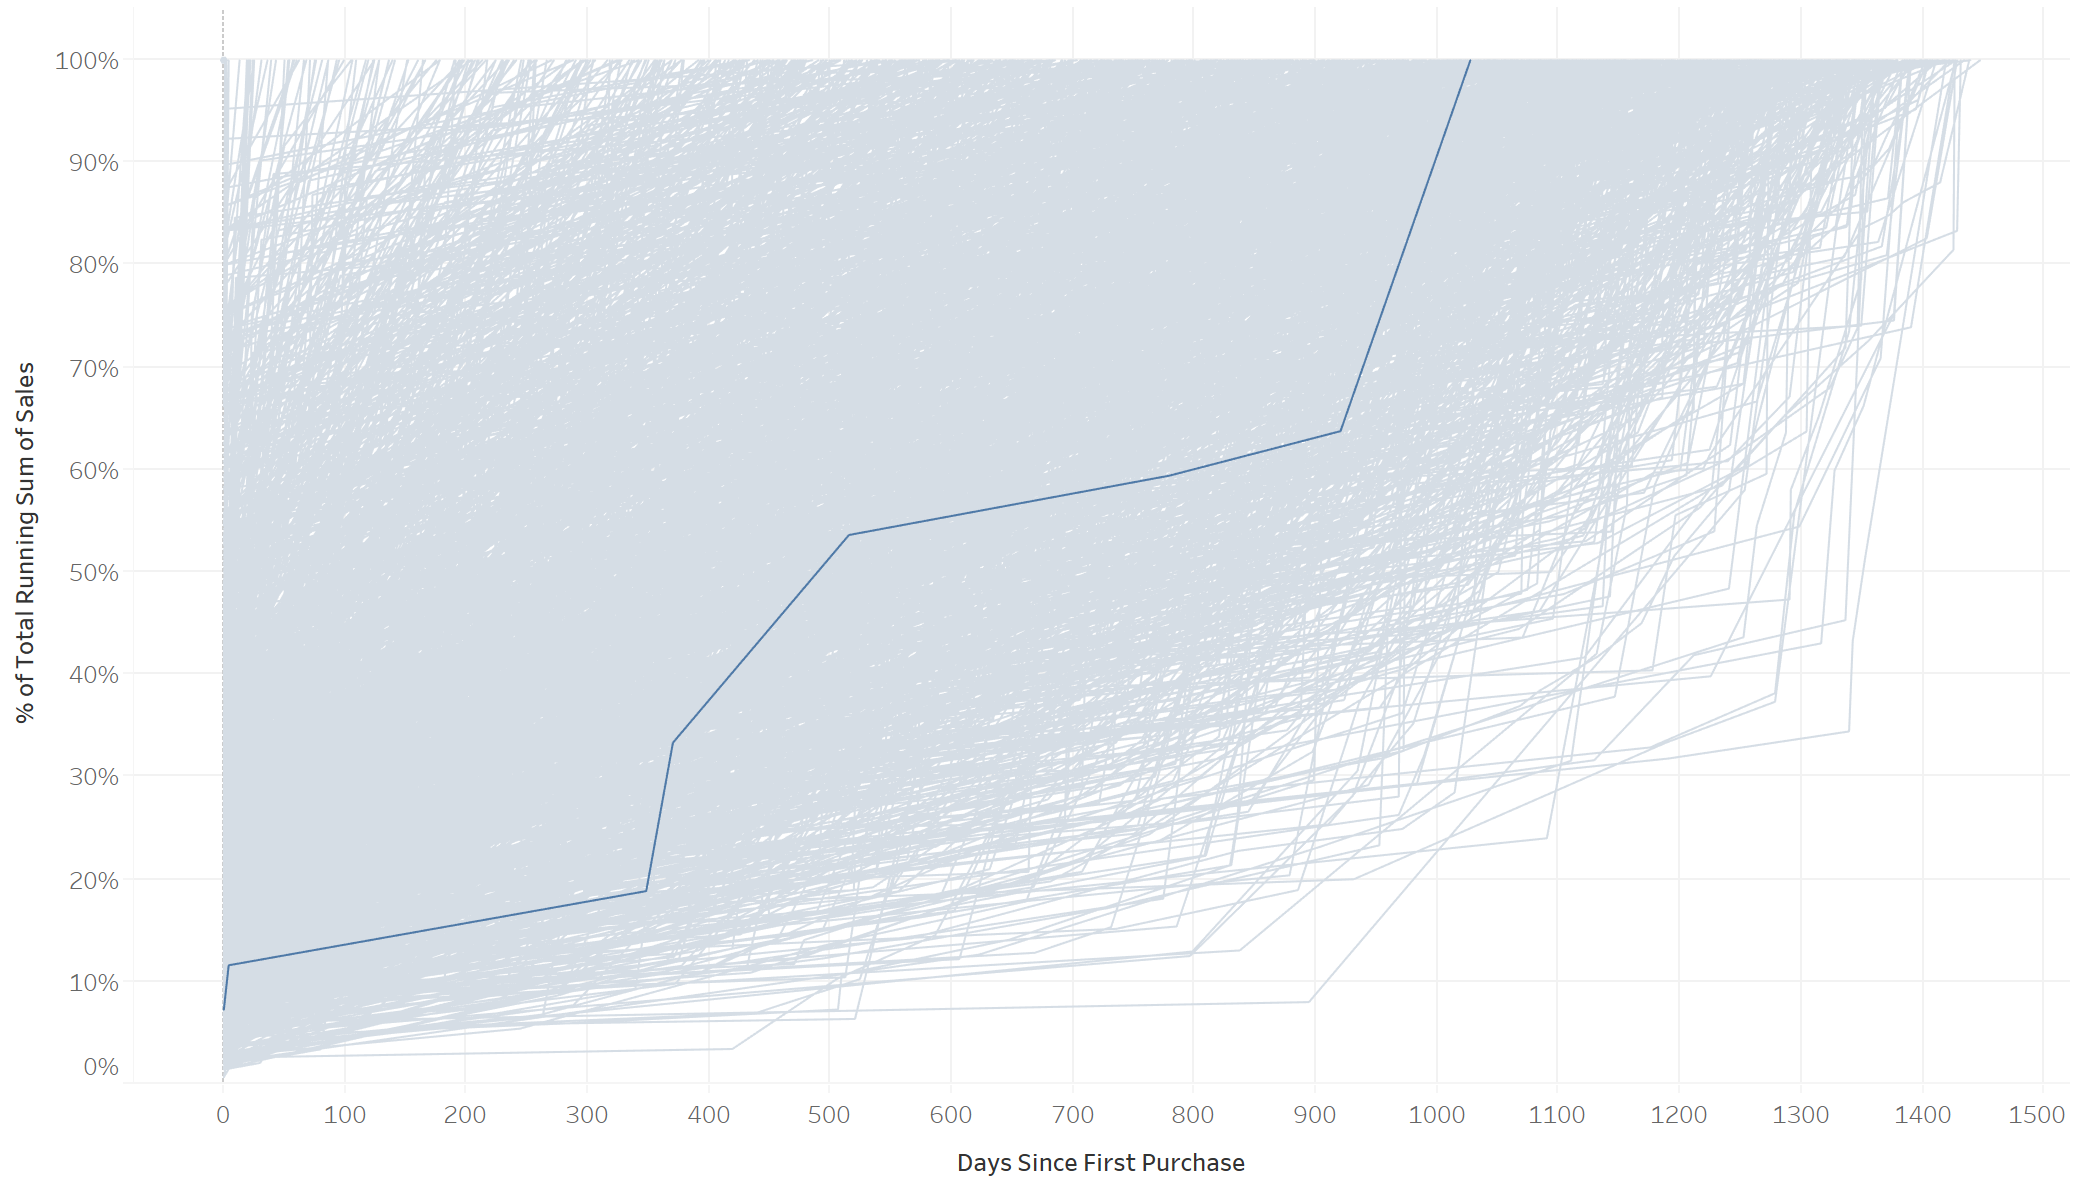
How long between first purchase and final purchase
It could also be useful to track products from their first to final purchase to see if some have become less favoured over time, if they had a long or short lifespan and if they were purchased recently. This example is similar to the first, using the following LOD calculated field:
DATEDIFF(‘day’,{ FIXED [Product Name] : MIN([Order Date]) }, [Order Date])
This gives the difference in days between every date of purchase and the first day of purchase. The LOD again is the middle part which takes into account every product, giving the first date it appears in the data set (first purchased). This can be put on the Columns shelf with Sales on the Rows which is given the table calculation percent of total. Product name will have to be put onto the Detail shelf to split the line into individual lines for each product. This will then track each product from 0 (first day of purchase) to 100% of sales (its last day of purchase).