Assumingly by this stage you’re preparing for your final interview or first interviews or even thinking of joining The Data School ( if you are thinking of joining please have a look at this blog post by Jack Perry which will take you through The DS application process in detail).
DS13 application
My initial application for DS13 was not successful and my feedback was that everyone else was more prepared than me – even though I was working so hard on my viz and didn’t even go out on Christmas and New Year’s which my friends really hated me for it! – but here are the lessons I learned from my first attempt:
- Don’t put all your effort just in creating your viz – there are also other important factors you need to keep in mind
- Prepare for your presentation and for your culture fit interview as much as you prepare for you viz
- Have a good understanding of The DS culture – you can find this out by visiting their blog post on The DS website
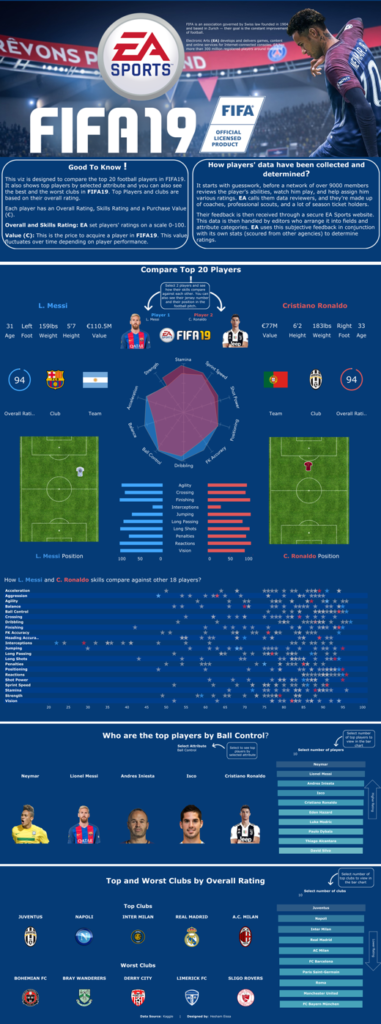
Here is my first attempt to my final interview:

The interview feedback was fair, but it was one of the worst news I ever had especially after finding out 2 days later that my dad passed away.
DS14 application
I didn’t give up because I knew this is my dream job and I was willing to do whatever it takes to improve and join The DS – this is when I decided to reapply again for DS14 and start the application process from scratch – but before that I had to improve my Tableau skills. The way I see it, MakeoverMonday is the best place to do that.
For my DS14 first stage, I wanted to show my Tableau skills I developed and that I worked on their feedback, so I created this viz:

I had a very positive feedback and was invited for the final interviews for DS14 – they also noticed my active participation in MakeoverMonday and mentioned it during the feedback – so if you are thinking of joining The DS build up your Tableau Public profile because they will have a look at your profile and see what you got in there – even if you build something that you don’t want to post, just do it! they also want to see how you improve over time, so don’t worry if you have a viz that only has a bar and a line chart .. just build up your profile.
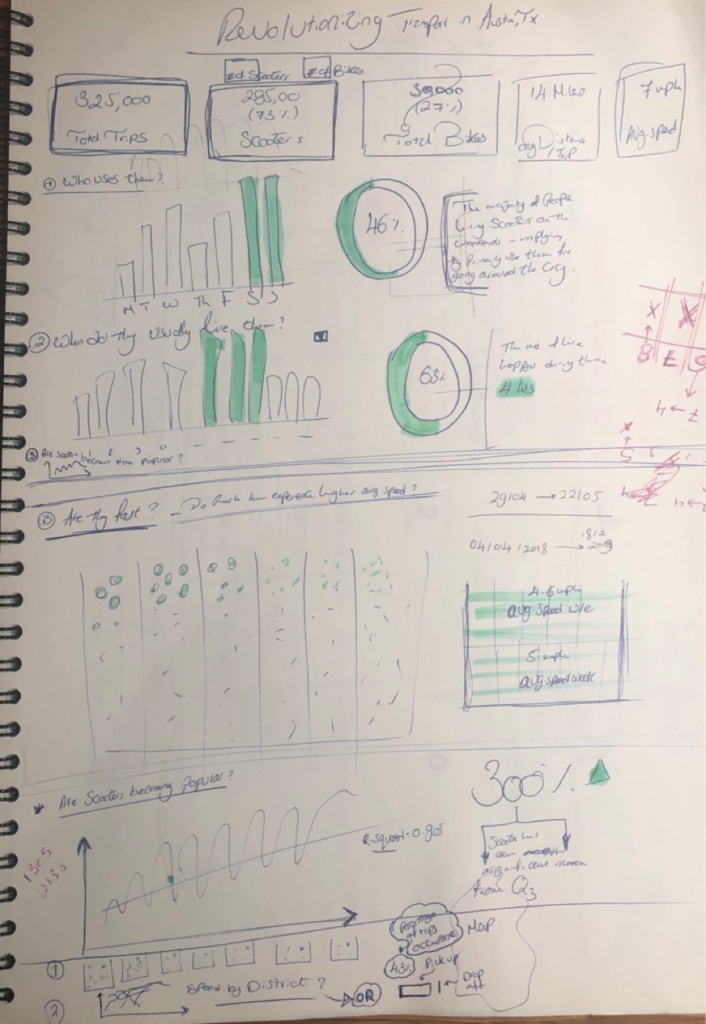
For DS14 final interview – Andy sent us a dataset of 2.8M records for us to analyse, find insights and come back in 8 days to present at The Data School. I had a look at the data and draw this to help me out with my approach:

It is always advisable to draw out your final outcome
I’m going to take you first through some challenges I faced throughout preparing my viz and then share with you some advices that might help you with your application.
Challenges
1] Too much data for Tableau to process at a time
It was taking Tableau so much time to process 2.8M records to create any chart (even a bar chart) and especially a map.
First thing I did after spending a valuable amount of time researching the topic – I investigated the data in depth and set everything to Discreteto have an idea of what to keep and what to filter out the data, so that Tableau can render normally. Doing that made helped me realize the following:
- The data was 98% focused on scooters and 2% focused on bikes and that’s when I decided to filter out bikes because it wouldn’t seem right/fair to compare both.
- The dataset had some wonky values, lots of nulls and negative values.
Filtering out all that allowed Tableau to process the data faster time and most importantly gave me an idea of my story (only dockless scooters).
You don’t need to use all the dataset given to you!
2] We were given 2 pairs of longitude and latitude

The dataset we received had 2 pairs of longitude and latitude – so basically, we had trip start longitude & latitude and also trip end longitude & latitude as shown below:
However, Tableau only allows you visualise one pair of longitude and latitude and I was so excited about the idea of showing the flow of trips to find some insights.
After spending a full day trying to get the flow, I came up with this cluttered ugly map:

There was no way to tell any story behind this map – however I was so determined and stuck in the idea of showing the flow between trip start and end – gave it another try and filtered out some values and came up with this:

Always think about the final result before trying to do something complex – I would have saved a full day if I had done so
There was also know way to tell any story behind this and that’s when I decided to go back to my reference: Andy’s Visual Vocabulary viz:

That’s when I decided to give the Sankey chart a go although I always used to avoid creating it because it looked complicated to me and required some data preparation – however I was lucky to find some sources detailing out the process of creating Sankey chart without any data prep which was ideal for my case because I had a huge data set to deal with and there was no way for me to do data prep – you can find the blog post here. Doing that, allowed me to see the flow of trips and also their magnitude and found really some interesting insights.
If you are creating a viz and you ever get stuck, I would highly recommend always going back to Andy’s Visual Vocabularyviz as a reference and I assure you will always get a new idea or learn something new
Here is my final outcome:

What helped the most me throughout the process?
- MakeoverMonday –I mean by that the weekly challenge, the viz review and undoubtedly the book
- Attending free trainings offered by The DS every month really helped with my table calculations my final interview viz – they run these training every month or every 2 months – go to meetup.com and search for Learn What The Data School Learns – they do free Tableau and Alteryx trainings
- Interacting more with the community allowed me to get to know many other Tableau enthusiasts and find interesting ideas and learn new stuff
- Reading others’ blog posts was also really helpful in exploring new techniques and ideas
Final advices:
- Build up you Tableau Public profile – from DS13 feedback until DS14 final interview I built around 25 vizzes
- Come to the free trainings they offer – you will learn a lot more than you think and it also sends a good message and shows your passion and interest in the company
- Participate in MakeoverMonday and get a weekly feedback from Andy, Eva and also the community
- If you don’t make it through the first time – do not give up and give it another try and develop based on your feedback – one of the great thing about The DS they give you more than one chance to reapply and develop which I am really glad for
- Reach out to any one at The DS, you are definitely allowed to receive feedback from them on your application and everyone there is willing to help
- If you ever get stuck or run out of ideas, have a look at Andy’s Visual Vocabulary viz
- Never give up!
If you need any help with your application please reach me out on Twitter, I will be more than happy to help!
