


When learning Tableau, it's tempting to jump in and start analysing a dataset without checking the quality of the data. However, this can lead to consequences down the line when messy data reveals itself and starts causing problems.
In the first week of Data School training, we've been focusing on Tableau Prep, a tool designed to clean, combine and reshape data to make it fit for subsequent analysis. In this post, I’ll introduce the basics of what Tableau Prep is, what it’s used for, and some of the core transformations it makes possible.
What problems do you find in real world data?
Data rarely arrives in perfect condition. Mistakes can be introduced by human error during recording, such as spelling mistakes or missing records. Other common issues include inconsistent field names, outdated data, and datasets that need to be reshaped before they can be analysed properly.
In an ideal world, data will fulfill a set of rules:
- One data field for each category or measure
- One data type for each data field (String, Boolean, integer, etc.)
- A single date column where possible (unless there are different date records in the data set - i.e. order date and fulfilment date)
- One row should be a record containing all the values in each data field possible
When data meets these conditions, it becomes much easier to analyse and visualise. Tableau prep can be used to clean messy data, and reshape it so it meets these conditions in preparation for analysis.
Preparing Data in Tableau Prep
One key difference between Tableau Prep and tools like Excel is the interface. In Tableau Prep, you design a workflow to clean and shape your data step by step, with each step represented visually in the interface, allowing you to see the whole process at once.
This has several major advantages:
- It makes the workflow transparent, allowing you to easily keep track of what you have done and where, allowing you to spot the origin of mistakes.
- It makes it possible debug your work, adding steps in the middle of your workflow, or editing a part of the workflow, without losing the subsequent steps.
- It makes your work repeatable, as you can upload fresh data and reuse the workflow.
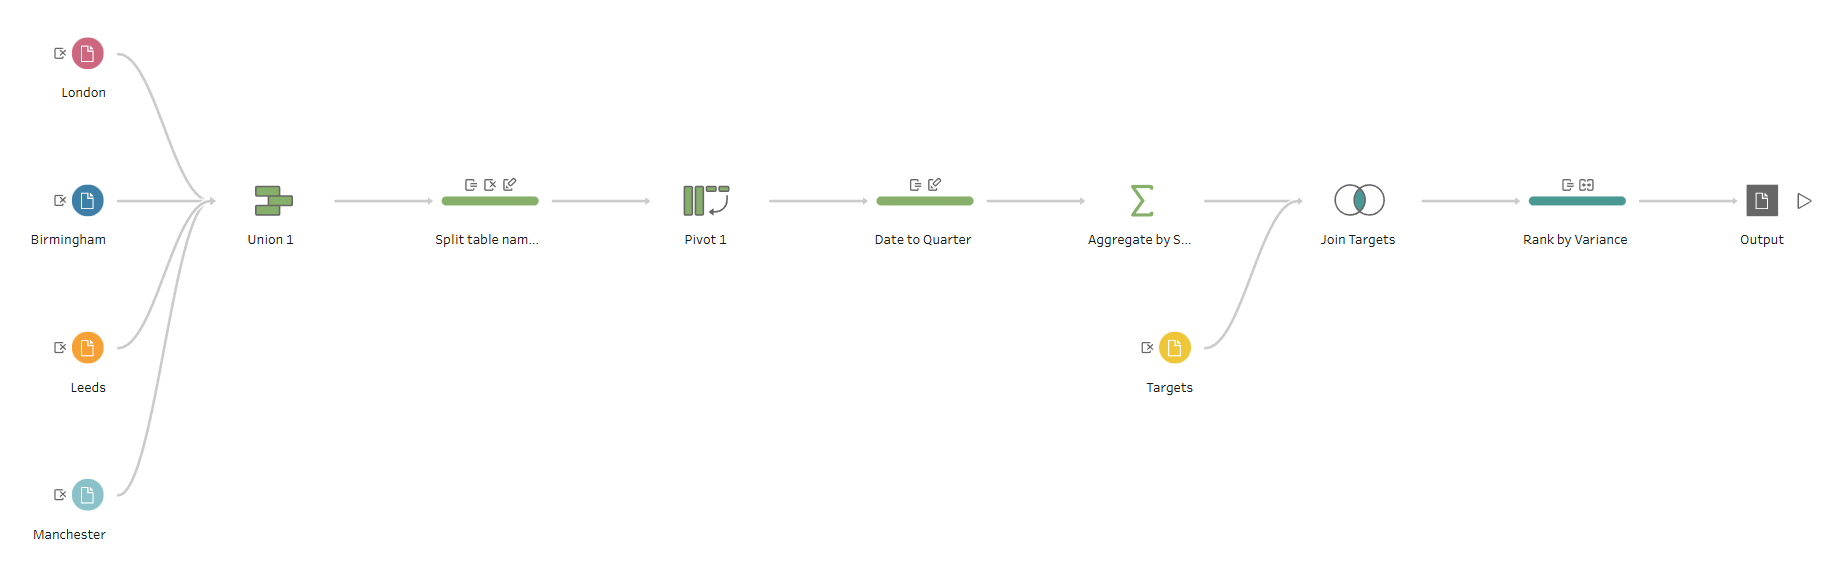
Standard Workflows in Tableau Prep
Preparing data for analysis will often involve the following steps:
- Inputting your data
- Transformation steps:
- Unions - stacking tables with the same structure
- Joins - merging tables with a field in common
- Pivots - turning a broad table into a long table (columns to rows) or making sure each field has its own column (rows to columns)
- Aggregations - calculations at a different level of granularity to your data (sums, averages etc.)
- Cleaning steps - fixing field names, splitting or combining fields, standardising spelling and formatting within a field etc.
- Outputting your new data
Together, these steps form a workflow that gradually transforms raw data into a clean, structured dataset ready for analysis.
Final Thoughts
Although visualisation is often the most visible part of data analysis, the quality of the analysis depends heavily on the quality of the data behind it. Taking the time to clean and structure data properly can make the rest of the analysis process much smoother.
Tools like Tableau Prep make this process easier by providing a clear, visual way to transform messy data into something ready for analysis.
In future posts, I’ll explore some of the core features of Tableau Prep in more detail.