


Something we learnt last week was how to set up a chart which will compare any given measure for the current year to date (YTD) with the previous YTD. This is a really useful tip which has many use cases, especially in a business sense. We are constantly looking to compare performance of different metrics to the previous year, month or even week, and with this tip, you can set-up views which will update automatically, so you never have to worry about amending your date calculations.
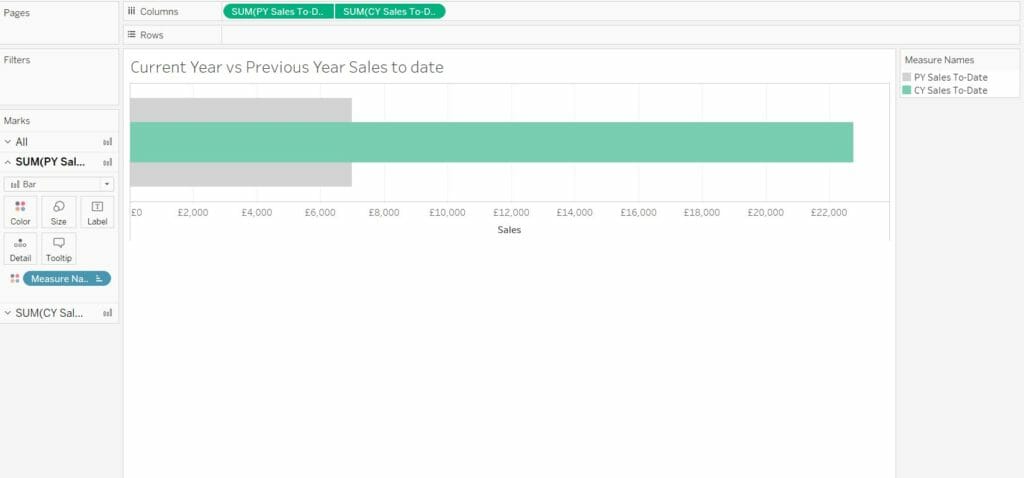
I have used the superstore data for this explanation so you should be able to easily follow along. The final view that we will create will show the total current YTD sales compared with the previous YTD sales, which can be seen below. For this demo, I have taken 2018 to be the current year as the superstore data set has no data for 2019 at the time of writing.
Setting up the calculations
The first calculation that needs to be set up, is to return today’s date. There is a function built into Tableau that reads the date off your computer called ‘Today’, this is how the charts will ultimately update automatically as the date changes. To do this, I created a calculated field named ‘today’ which reads…
TODAY()
Simple enough right? The next calculation I set up becomes slightly more complex, it returns the sales of the current year to date.
IF [Order Date] <= DATEADD(‘year’,-1,[Today])
AND YEAR([Order Date]) = YEAR([Today]) – 1
THEN ([Sales])
END
This reads, if the order date is less than or equal to the date of today, minus one year, and the year of order date is equal to the year of today, minus one year, then return sales. The reason I have had to minus one year for the current year calculation, is due to the fact I am using 2018 as ‘current year’. If there were data for 2019, the ‘current year’ calculation would read as follows:
IF [Order Date] <= [Today]
AND YEAR([Order Date]) = YEAR([Today])
THEN ([Sales])
END
The calculation for the ‘previous year sales’ is nearly exactly the same as that for current year, except, you guessed it, I took away 2 years from today (or 1 if I had data for 2019).
IF [Order Date] <= DATEADD(‘year’,-2,[Today])
AND YEAR([Order Date]) = YEAR([Today]) – 2
THEN ([Sales])
END
Once I had the calculations set up, I could begin to create my view.
Setting up the view (bar-in-bar)
I’m going to show you two ways in which you could now set up the view, the first is to use a bar-in-bar chart. To do this, I put both ‘current year sales to date’ and ‘previous year sales to date’ onto the columns shelf. I then made this into a synchronized dual axis by right clicking on one of the fields in the columns shelf and selecting ‘dual axis’ then ‘synchronize axis’. At this point, Tableau might default your marks to circles, if this is this the case, then change them back to bars in the marks card. Finally, I changed the size of the current year bar, to appear inside the previous year, and put the previous year bar to the back of the view, by making sure the field is placed first on the column shelf. There you have it, a bar in bar showing current year to date sales with previous year to date sales. This view is the same as the image shown earlier on in this post.
Setting up the view (reference line)
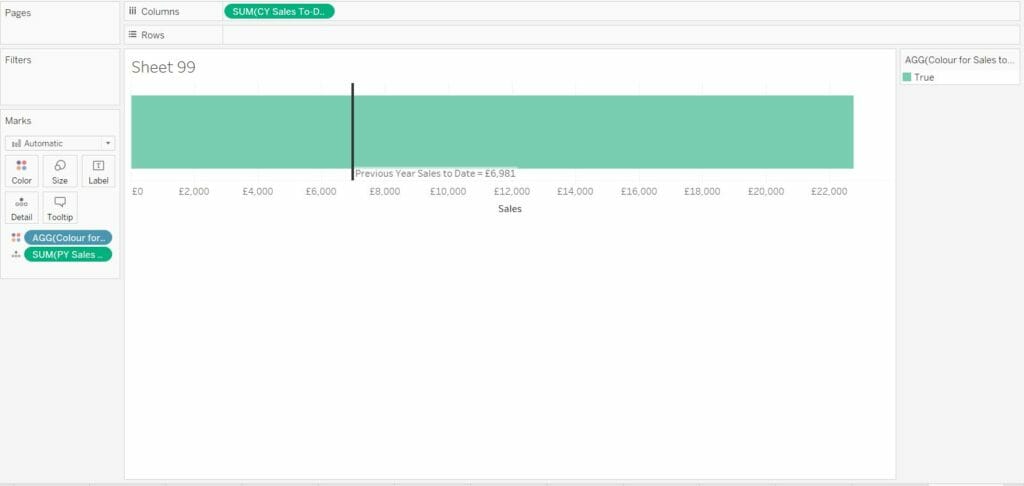
The second view I’m going to explain, uses the previous year as a reference line and colours the current year sales depending if it is above or below that line. To set up the view I have put current year sales onto the columns shelf, and previous year sales onto the detail shelf. Next, in the analytics pane, I have added a reference line to the view, by dragging reference line onto the view and applying it to the cell. In the reference line set up, I have selected the value to be SUM(PY Sales To Date) and made some formatting changes to label the line and make it stand out. Next, I have written a calculation to determine the colour of my bar, depending if it is above or below the reference line.
SUM([CY Sales To-Date])>=SUM([PY Sales To-Date])
Finally, I have added this calculation to the colour shelf, in this instance, the calculation only returns true, as there is only one mark in the view and it is above the reference line, however, if this was to drop below the reference line, a false value would appear and you would be able to colour the line differently. This colouring technique can also be used in the bar-in-bar technique. The final view of the reference line chart can be seen below.
As I mentioned, this is a very useful technique which can be used in many scenarios, whether that be for business visualisations or personal ones, such as tracking sports performance vs previous year. That’s all from me for now, I hope you find this tip useful in your work!
Give me a follow @JaackParry and check out my noneofyourvizness blog!