This will be the first in a multiple part series where I look at the different data prep methods I used during a Friday project when I had to recreate a moving average Tableau table calculation using macros in Alteryx.
Before I could start making a moving average macro, there were a few things I had to consider in terms of data prep.
First, was my data aggregated at the level of time that I wanted? I was using the Tableau Superstore data where each row has an order date at a day level. I wanted to create a moving average across months, so I had to aggregate my data.
Second, was the data missing any dates in the range that it covered . As I was going to look at each US state separately, each state had to have sales data for every month. This wasn’t the case as sometimes states went a whole month without selling something.
Aggregating by Dates
In order to aggregate data to a higher date level, you can truncate the date field. In my case, I wanted to truncate the Order Date from a day level to a month level. This essentially changes the day part of the Order Date to the first day of the month.
23/07/2019 ➡ 01/07/2019
If you want to truncate to a year level, then both the day and month parts would need to change to ‘1’.
23/07/2019 ➡ 01/01/2019
To truncate dates in Alteryx, we can use the Date Time Tool  . Typically this tool is used to change the format of a date, but you can also substitute parts of a date for a different value. To do this, select Custom from the list of format options. This allows you to edit the custom format at the bottom of the configuration pane. To truncate to a month level, change yyyy-MM-dd to yyyy-MM-01.

Now that the dates have been truncated, the data is ready to be aggregated. I want to aggregate my Superstore data, so that for every state, there is only one row for each month. In the example below, the Sales values for the two rows of April ’16 have been summed.
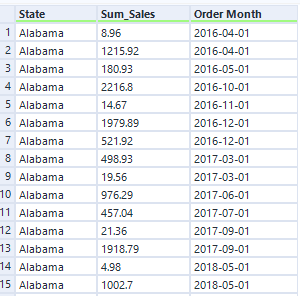
⬇
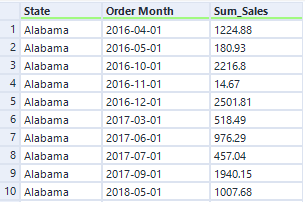
I did this using the Summarize Tool  configured as below.
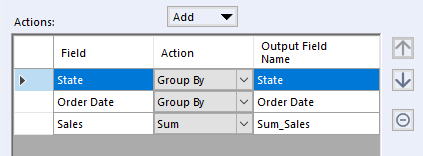
Scaffolding: Adding the Missing Dates
The second part of the data prep was to fill in the missing data, so that for every missing month, there’s a row with a Sales value of 0. Padding data with missing date rows is quite common in data prep and is known as scaffolding. Although there is more than one way to scaffold data, I chose to use the Generate Rows Tool  .
.
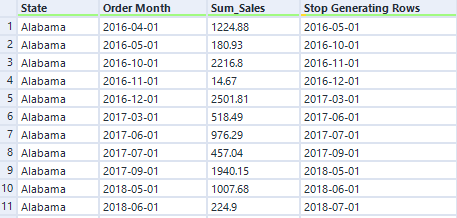
This tool allows you insert new rows of data into your table based on a condition. In this sample of the data, we want to insert rows for June to September. We can do this in the Generate Tool by essentially adding 1 to the month part of the date until it reaches 10. This is where the condition comes in.

The condition will say that while the row below is greater than each newly generated row, generate another new row with an extra added month. Since the Generate Row Tool can’t look across multiple row, the Multi-Row Formula Tool  has to step in first. The configuration below pulls the date value from the row below to the current row in a new column which I have named ‘Stop Generating Rows’.
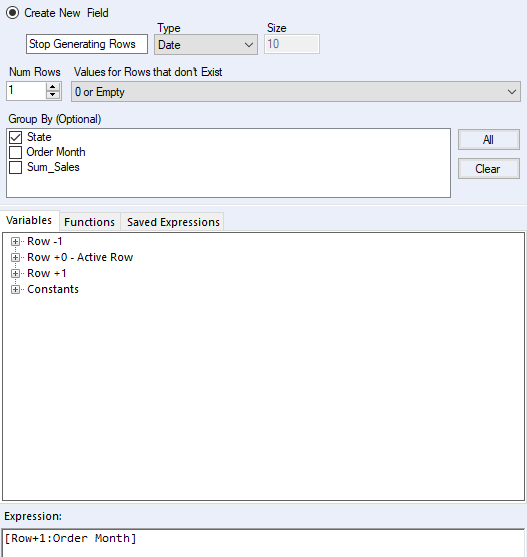
⬇
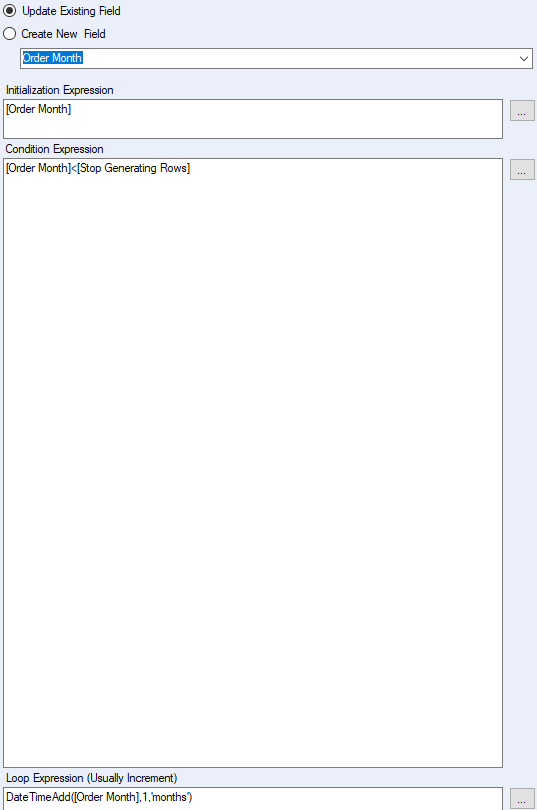
Now we are ready to configure the Generate Rows Tool  . At the bottom of the configuration pane, we have a DateTimeAdd formula which adds a month for each new row for long as the condition is true.
⬇
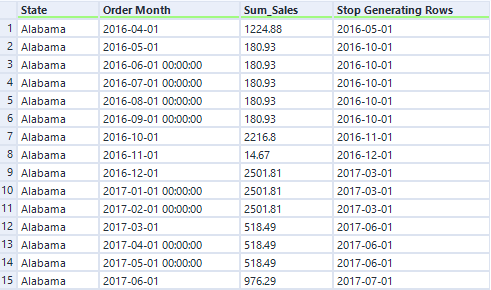
The problem with this output is that the newly generated rows have copied the sales value from the original row above when we want the new rows to have a zero value, as nothing has been sold in these months.
We can fix this with an if statement in a Formula Tool  that says if the row is a newly generated row then make the sales value 0. But how do we know which rows are newly generated? That’s where we need to create some kind of marker.
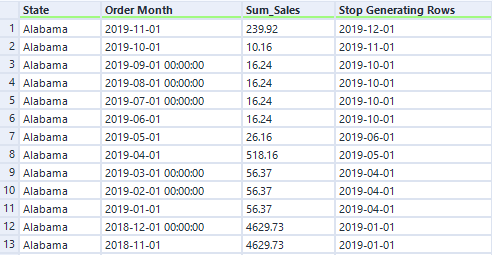
If we reverse the order of the dates with the Sort Tool ![]() as I’ve done below, we can create another Multi-Row Formula which says, if the ‘Stop Generating Rows’ is equal to the row below, then make it null. This null value will be our marker.
as I’ve done below, we can create another Multi-Row Formula which says, if the ‘Stop Generating Rows’ is equal to the row below, then make it null. This null value will be our marker.
⬇
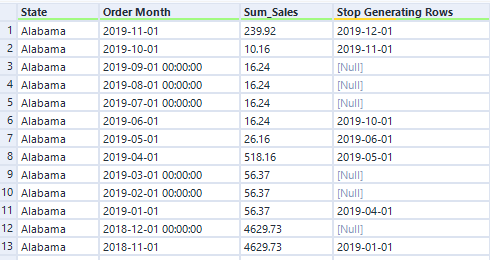
We can now make the if statement using the Formula Tool  .
.

⬇
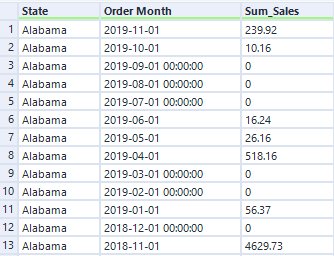
And with that, the data prep is done and ready for the Moving Average Macro to do its work.
