


For all of the analytical experience I have collected over my first three months of Data School training, I have not had the opportunity to take my time on a longer term project that applies everything I have learned so far. To remedy this, I decided to start a major personal project that would span from Alteryx to Tableau, covering principles in data preparation as well as design best practices. I am personally a fan of Star Trek, so I decided to center the show as my topic, specifically honing in on the sequel series The Next Generation, which aired from the late 1980s to the early 1990s.
There are many datasets relating to Star Trek out there, but I wanted to stretch my webscraping and text parsing abilities, so I set the goal of obtaining every word of dialogue from every one of the 178 episodes of the show. Fortunately, I am not the only one who loves both Star Trek and data – the creator of Star Trek Minutiae dedicated a lot of time compiling scripts from all of the series, as well as a lot of detailed information about the show's history.
I decided to use the individual scripts available on pages that look like this:
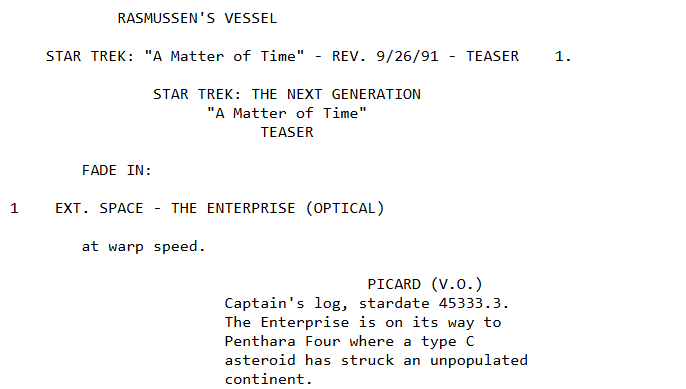
The real challenge of this segment of the project was the pagination; each script is its own website, with a URL that looks like "https://www.st-minutiae.com/resources/scripts/209.txt". I figured out that the "209" in the URL means that this is the 109th episode (the numbering starts at 101 for the 1st episode).
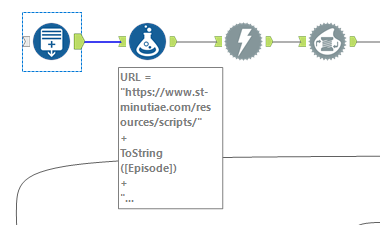
To account for this, I started with a generate rows tool in Alteryx to make a calculated column with all of the integers from 101 to 278, then connected the output to a formula tool to wrap these numbers into a generalized URL form.
Next, I put all 178 rows through a download tool to obtain JSON for all of the 178 pages and used the JSON parse tool to make a cleaner output.
It would not be useful to have 1 row that messily contains all of the information for a single episode. Instead, I would want far more granular separation of rows so that a row either contains a single line of dialogue or even a single word. To achieve this, I used the text-to-columns and filter tools in succession:
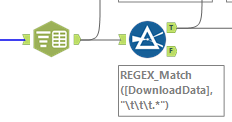
The text to column filter uses the new line character "\n" as its delimiter, to ensure that every row of its output is an individual line from one of the scripts. This expanded the previous 178 rows to approximately 566,000 lines. These were not all lines of dialogue though! The scripts from Star Trek Minutiae were full of stage direction and other background notes describing scenes. I noticed that the dialogue only seemed to be on lines with three tabs worth of indent, so I used a REGEX_Match formula within my filter tool to only retrieve rows that started with three straight instances of the tab character "\t". After removing these tabs, I had created one row for each line of dialogue from the show:
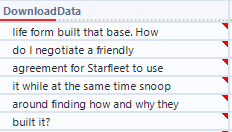
This is a great start, but the dashboard I want requires slicing up this dialogue down to the speaker level and the individual word level (to try to do some thematic analysis) – not to mention the red marks here indicating invisible leading spaces that need to be cleaned. Stay tuned for Part 2 for the remainder of the data preparation for my Star Trek project!