


A thought experiment prompted by Carl Allchin
Brentford are known for finding value where others don’t. But how would you apply a data consulting approach to scout a right-back on a tight budget? From data sourcing, to attribute selection, to visualisation, here's how I'd start to break it down.
Data Sources
When thinking about data sources, I looked to try and avoid the most popular sources that all football teams would used (e.g. Opta). After a bit of research I narrowed it down to three options.
Transfermarkt can be used for all of your general player information like contract details, age, transfer value and minutes played. Smarterscout which is a platform that allows for a more profile based approach to scouting as apposed to the traditional performance based approach. Finally, in-house data from scouts and analysts to provide personal rating and allow for any stats to be contextualised.
Attributes
Next up was to figure out what metrics should be used to judge players. These attributes were split into three key groups defensive, offensive and progression.
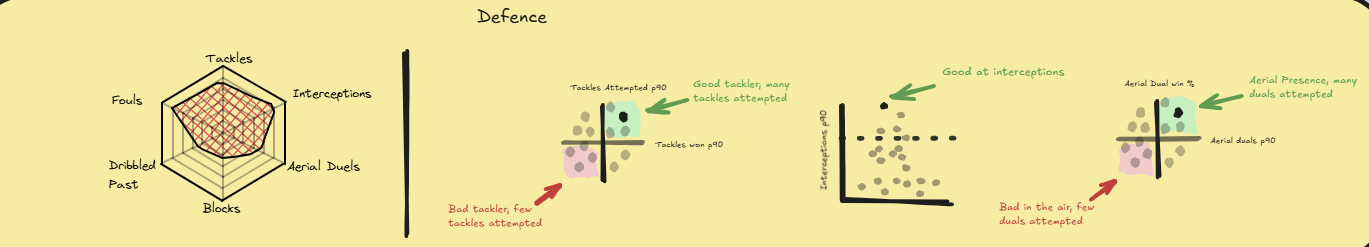
Defensive
- Tackling (tackles per 90, tackle success rate, tackle attempted)
- Interceptions per 90
- Aerial Duals (aerial Duals per 90, aerial dual win rate)
Offensive
- Crossing (crosses per 90, cross success rate)
- Assists (assists, expected assists per 90)
Progression
- Progressive passes per 90
- Progressive carries per 90
Weighting
So for this tool, I could just rank the players based off of how they score in these attributes but this leads to a key problem. What if a player is ranked very highly due to their offensive capabilities but their defensive statistics leave something to be desired.
To combat this, I thought it would be a good idea to have two different weighting systems to score and then rank players. A more offensively focused weighting and a more defensive one. This would allow the recruitment to switch between different player recommendations depending on what type of player they are looking for.
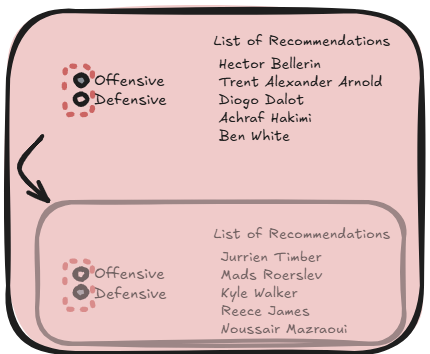
When asking questions about the feasibility of this kind of parameter, I was told about a similar type of player recruitment tool visualisation made by Sam Parsons. This tool actually allows the user to select how they want to weight each individual attribute themselves which I found really cool.
Charts
Once the recommendations have been made, I then wanted to allow the user to select a player and explore their stats with some deeper analysis. The charts I would use are a combination of quadrant plots, jitter plots, and radar charts. Scatter and jitter plots help show how a player compares to others across key stats, highlighting patterns, differences, and standout performers. Radar charts give a clear visual summary of a player’s strengths and weaknesses across multiple areas.
Next Steps
To wrap things up, I think this is a really solid starting point for building a scouting tool that gives the recruitment team player recommendations based on whatever stats they care about most. Being able to dive into a detailed breakdown of each player’s numbers adds some really useful context (you might even spot some surprising outliers).
Off the back of these ideas (and Sam Parson’s work too), I reckon adding transfer value data from Transfermarkt.com would be a smart move. That way, users could filter players by value, which is especially handy when you’re looking for hidden gems.
After chatting with Carl Allchin, we also spoke about bringing in a time element to show how a player’s performance is trending over time. I think that could really take this idea to the next level, and it’s something I’m keen to include as I attempt to build this into a proper working dashboard in Tableau.