


Our final dashboard week challenge revolved around answering questions relating to the gender pay gap in London and the rest of the UK. The task ran over two days and involved data preparation in Alteryx as well as building a Tableau dashboard.
In this blog, I'll discuss my methods, logic for data prep, output and what challenges I faced.
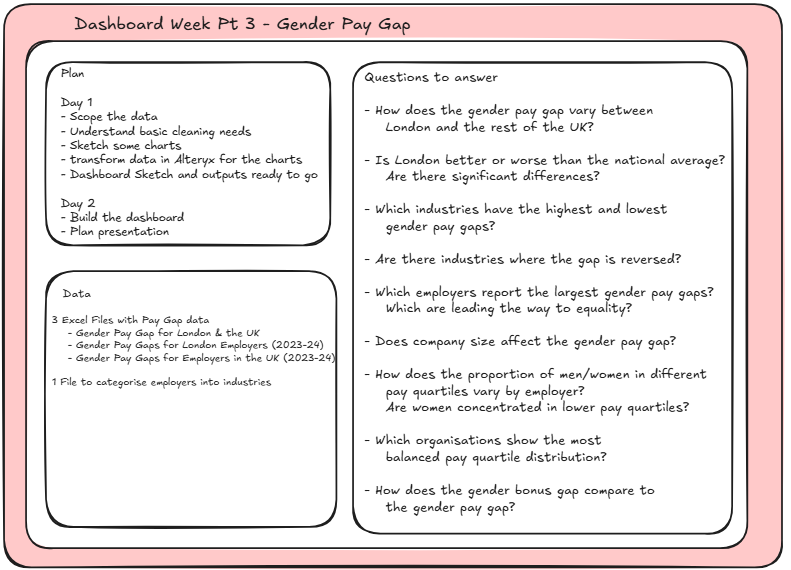
Planning
The data I received included 3 excel files.
The first being an overview of the pay gap from 1997 - 2023 (included sheets with hourly pay details). The data had values for both London and the UK.
The next 2 excel files contained pay gap data and bonus gap data at an employer level. One file contained employers in London and the other for the UK. We were then provided with an extra table which we could link with the Employer SIC code to get the division (industry) the employer was in.
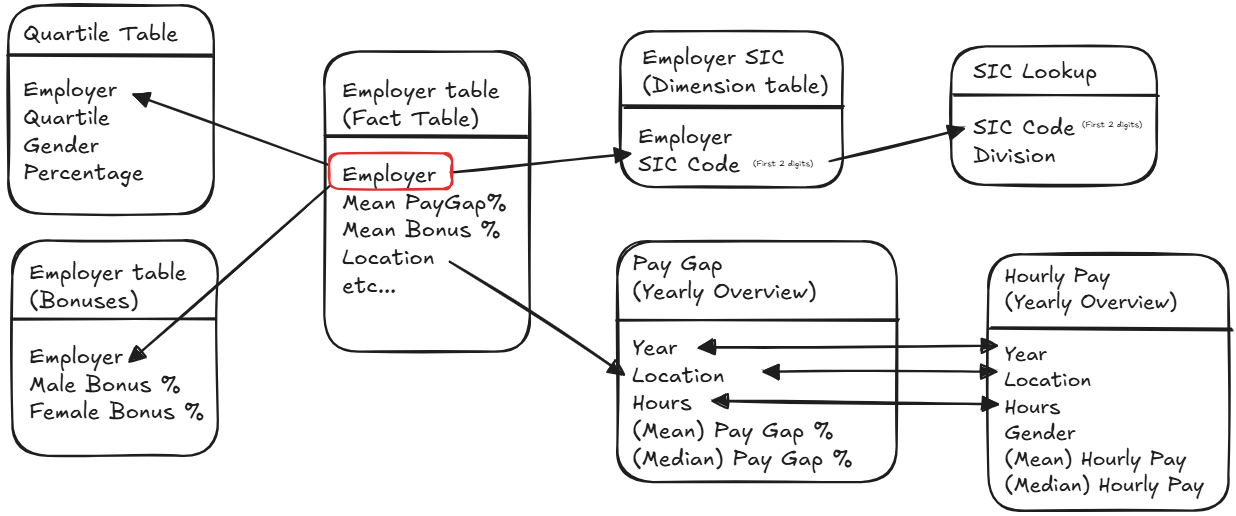
To make working with the data easy in Tableau, it made sense to break up the tables into differing levels of granularity, based on their purpose (E.g. the 'quartile' table would be at a quartile level, while the 'employer' table would be at the employer level.).
Linking the Employer SIC code to the industry lookup table was quite challenging as a single company could have multiple SIC codes associated with it. This lead to the decision to create a completely separate 'employer SIC' table to preserve the granularity of the original 'Employer' table. The two tables could then be linked on 'Employer ID'.
The two yearly overview tables were kept separate as they would also be at differing levels of granularity.
Data Prep
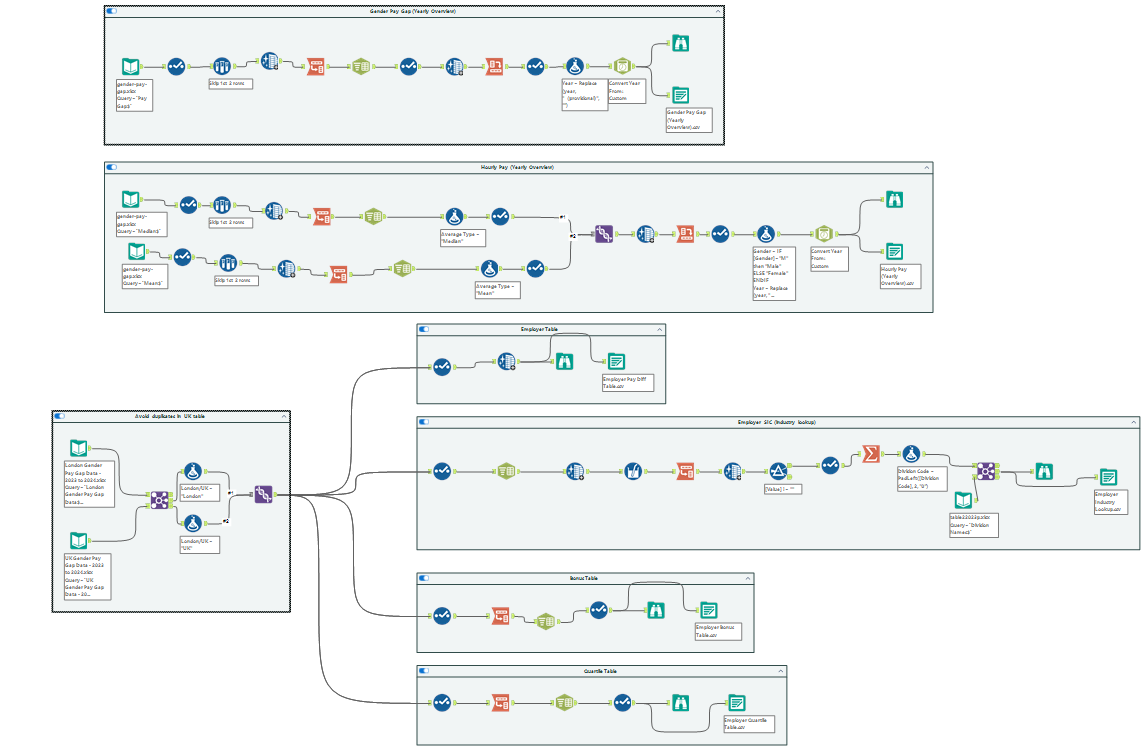
Overview Tables
To clean the two overview tables (top 2 containers), I renamed the columns to ensure the correct format to transpose the data.

I then transposed and used a text to columns tool to break up the dimensions into their own individual columns.
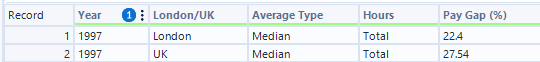
At this point, I realised that the Average Type column did not follow correct data structure conventions, as I would have two measures in one column. To solve this, I used a crosstab at the end of the flow to split those two measures out into two separate columns. I also added a datetime column.

This process was essentially the same for the hourly pay tables, which required a union to begin with (one table used the mean while the other used median).

Employer Table
The Employer datasets had a slight issue in that the UK table contained the London employers. If we wanted to compare London employers to the rest of the UK, we would need to get rid of these duplicates. To do this, I joined the two data sets and combined the inner join output (only the London companies) with the right join output (only the UK companies) with a union tool. A flag column was created for both of these join outputs to note the location of the employer.
From here, I could then create the employer table, by simply bring through the required columns.

Employer SIC (Industry Lookup) Table
As mentioned, the Industry Lookup table was slightly more complicated to make. An employer could have multiple SIC codes within a single data field.
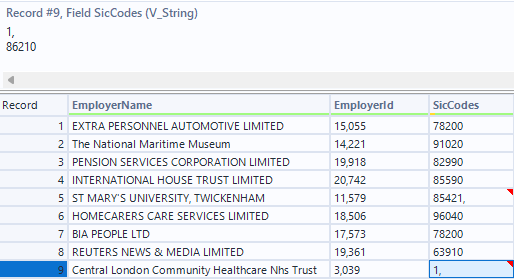
Using a text to columns, I split all of the SIC codes into separate columns. Using a Multi-field formula tool I only took the first two digits of these SIC codes (the first two digits indicate the company division (industry). I could then transpose these columns, get rid of any blanks and get rid of duplicate divisions with a summarise tool. This could then be joined with the Division name table provided.

Quartile and Bonus Tables
Making these tables were simpler and required a similar technique used in the overview tables. The columns were transposed and a text to columns tool was used to get the dimensions (e.g. gender) into their own columns.


Dashboarding
Once all of the data prep was done, I could load all of the tables into Tableau and get to building some charts.
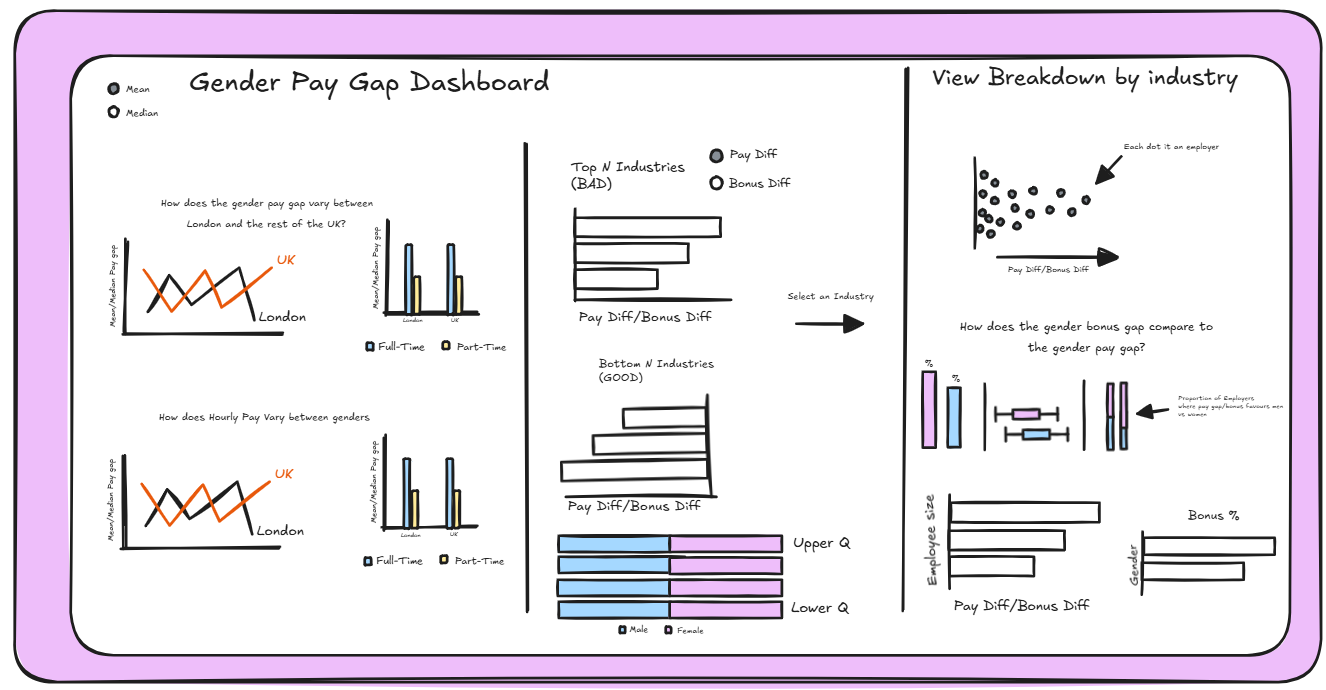
I took an exploratory approach with this dashboard, building it to provide the user the tools to gain insights and answer the questions they want to answer. This included options like selecting mean/median values, looking at Pay difference/bonus difference or filtering by particular industries.
Final Output

This challenge was genuinely really fun and the data was so interesting. I really enjoyed the Alteryx aspect of the challenge and I think there are some pretty cool insights to be gained.