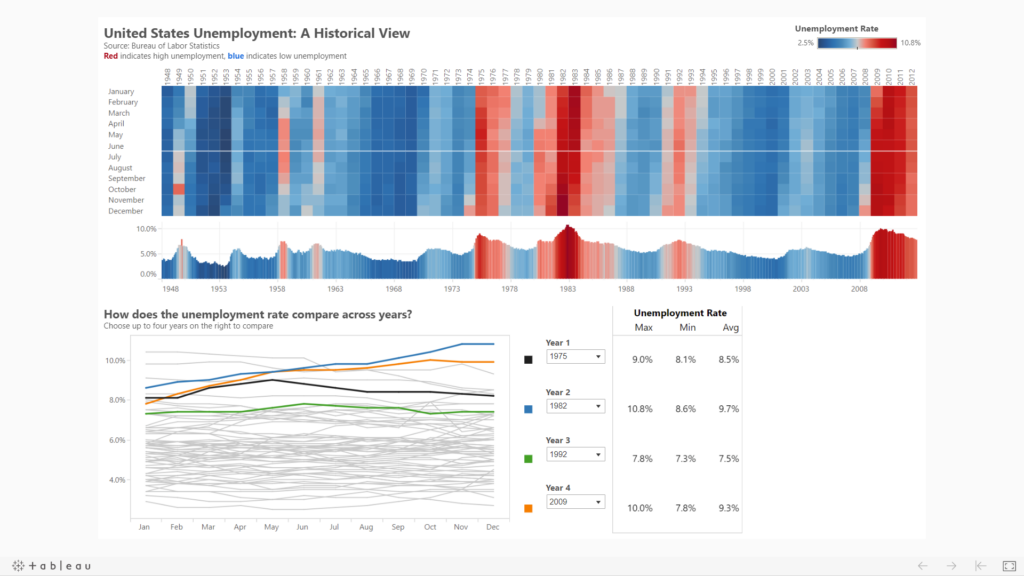
Today Andy assigned us (DS21) each with a viz of his from when Tableau Public first launched to critique, to which my first thought was ‘I really wish I had payed attention in his Data Viz 101 classes’. Nevertheless, I was eager to see what viz Andy had assigned to me. Andy had assigned me with a viz he had created on US unemployment, as shown below:

After taking a quick look at his work, I could see multiple components of the viz that went against what Andy had taught us over the last few weeks. There was plenty of room for improvement.
Use of color
At first glance there is a lot of color in this viz which is unnecessary, and there is no clear color scheme. I liked the use of red and blue in the heatmap, with red evoking a negative emotion for high unemployment rates, and blue doing the opposite for low unemployment rates.
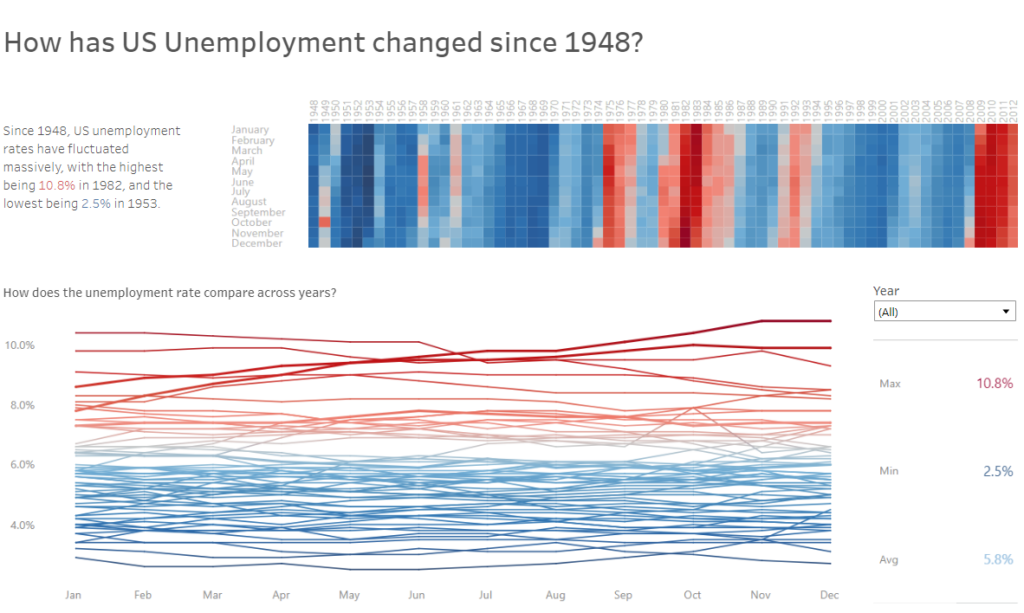
In the graph comparing unemployment rates across years, we can see four different colors for four different selected years. Less is more when it comes to color in visualizations, so it may be more useful to use the red-blue color scheme in this graph as well. This change would make the visualization a lot more consistent.
Formatting
The formatting in this viz is all over the place. There are multiple fonts, font sizing and boldness throughout, making the viz look messy and inconsistent. This is easily solved by using uniform fonts for headings, subheadings and bulk text. When it comes to the formatting of the graphs, they often look much cleaner without grid lines and dividers where they are not necessary, and so can be removed. Also, the use of a legend isn’t necessary with the sentence before the heatmap.
Key message
This viz is trying to show how US unemployment rates have changed over time, however there are no clear questions that are being answered. Which year had the lowest/highest unemployment rate? What caused this rise/dip in unemployment? We can make the key message clearer by using a question in the title, and perhaps using text to highlight key findings.
Filters/Interactivity
I really liked the filters used in the bottom half of the viz when comparing four years, however this created a problem with the use of color. It might be better just to see one year at a time, and perhaps use a highlight function to involve the heatmap as well?
Context
There could definitely be some improvements in terms of context. We could add an average line to the line chart, the percentages change to the previous year in the tooltip, or subtitles with key insights.
Chart Choice
The choice of charts is okay, but there is no need for the bar chart as it shows the same thing as the heatmap.
My take on the viz

Summary
There are still many iterations I would like to make, such as adding more text and tooltips for context, and perhaps improve the interactivity more. However, I feel what I have done in the time given has improved the viz alot.
(I don’t think color is spelt like that, the red lines annoyed me)
