


Density Maps are a simple yet highly effective way of showing the concentration of points in an area. In this blog I will show you how to create Density Maps, firstly without and then with Hex Bins. The data set I used explored rat sightings in New York City.
How to make Density Maps
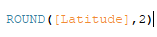
- The first step is to round both the longitude and latitude fields. The degree to which you round will determine how many data points will be outputted onto the map. In this example we round to two decimal places.
2. We now drag both the rounded longitude and latitude fields into the columns and rows shelves respectively. Select the mark type you prefer to use, here I used square.
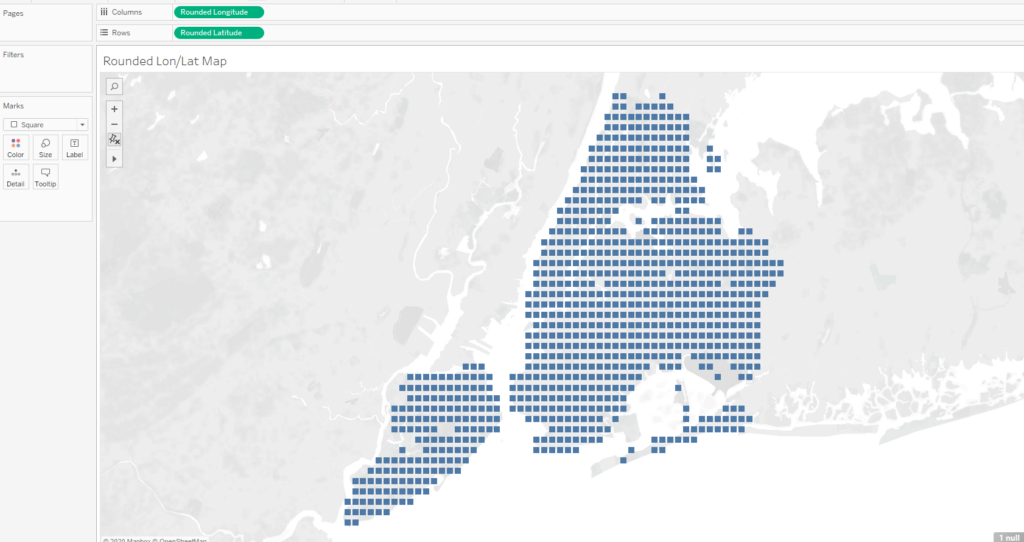
3. To add colour to the map, drag the appropriate measure onto the colour shelf.
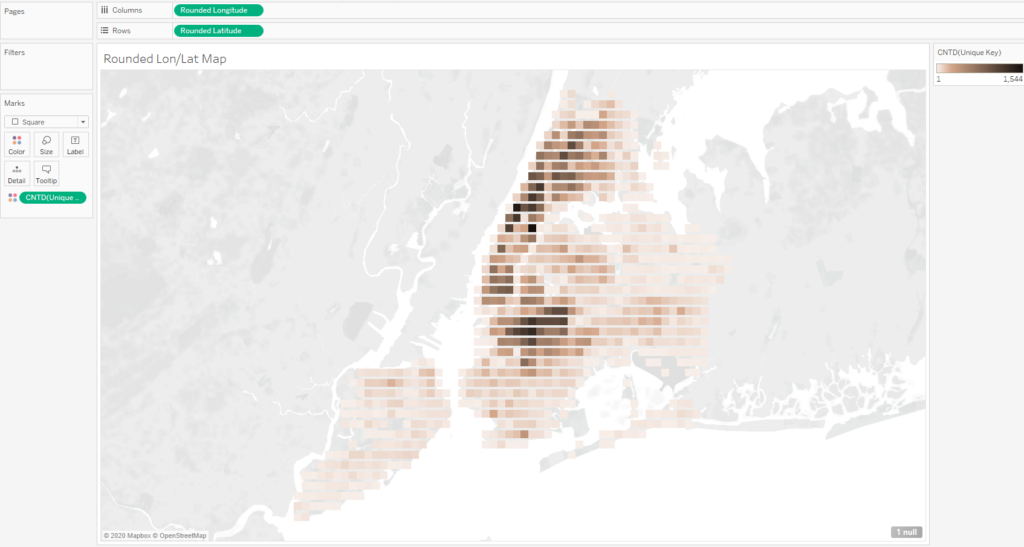
And that’s how you create a simple density map! Now onto Hex Bins.
Density Maps using Hex Bins
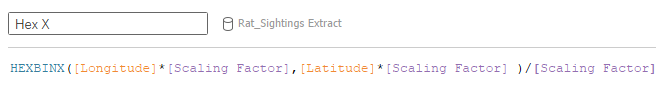
- The first step in this method is to create a parameter called ‘Scaling Factor’. This will determine how many bins will be in the view.
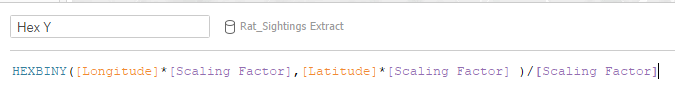
2. We now need to create Hex Bins for both longitude and latitude. We can do this using the functions HEXBINX and HEXBINY.
3. Now drag Hex X and Hex Y onto columns and rows respectively. You can set your scaling factor to add more or less bins into the view.
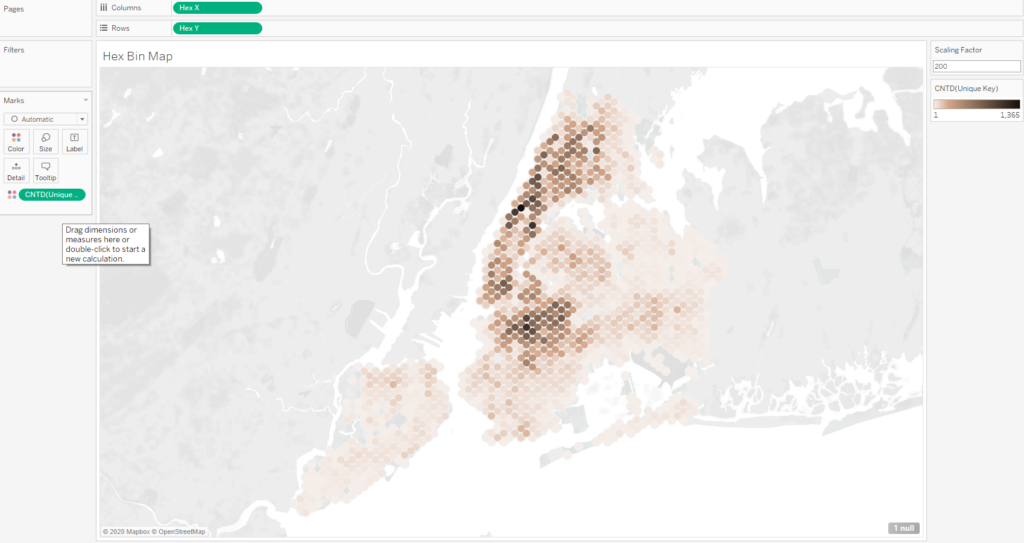
It’s that simple!
The benefit of using Hex Bins instead of rounding the longitude and latitude is that you have a lot more control over how many ‘Bins’ are in the view.