The concept of predictive modelling can be daunting when just beginning to learn about it and its underlying logic. At least in my case, the buzz word term of machine learning sent pictures of Bladerunner and rogue AI running through my mind.
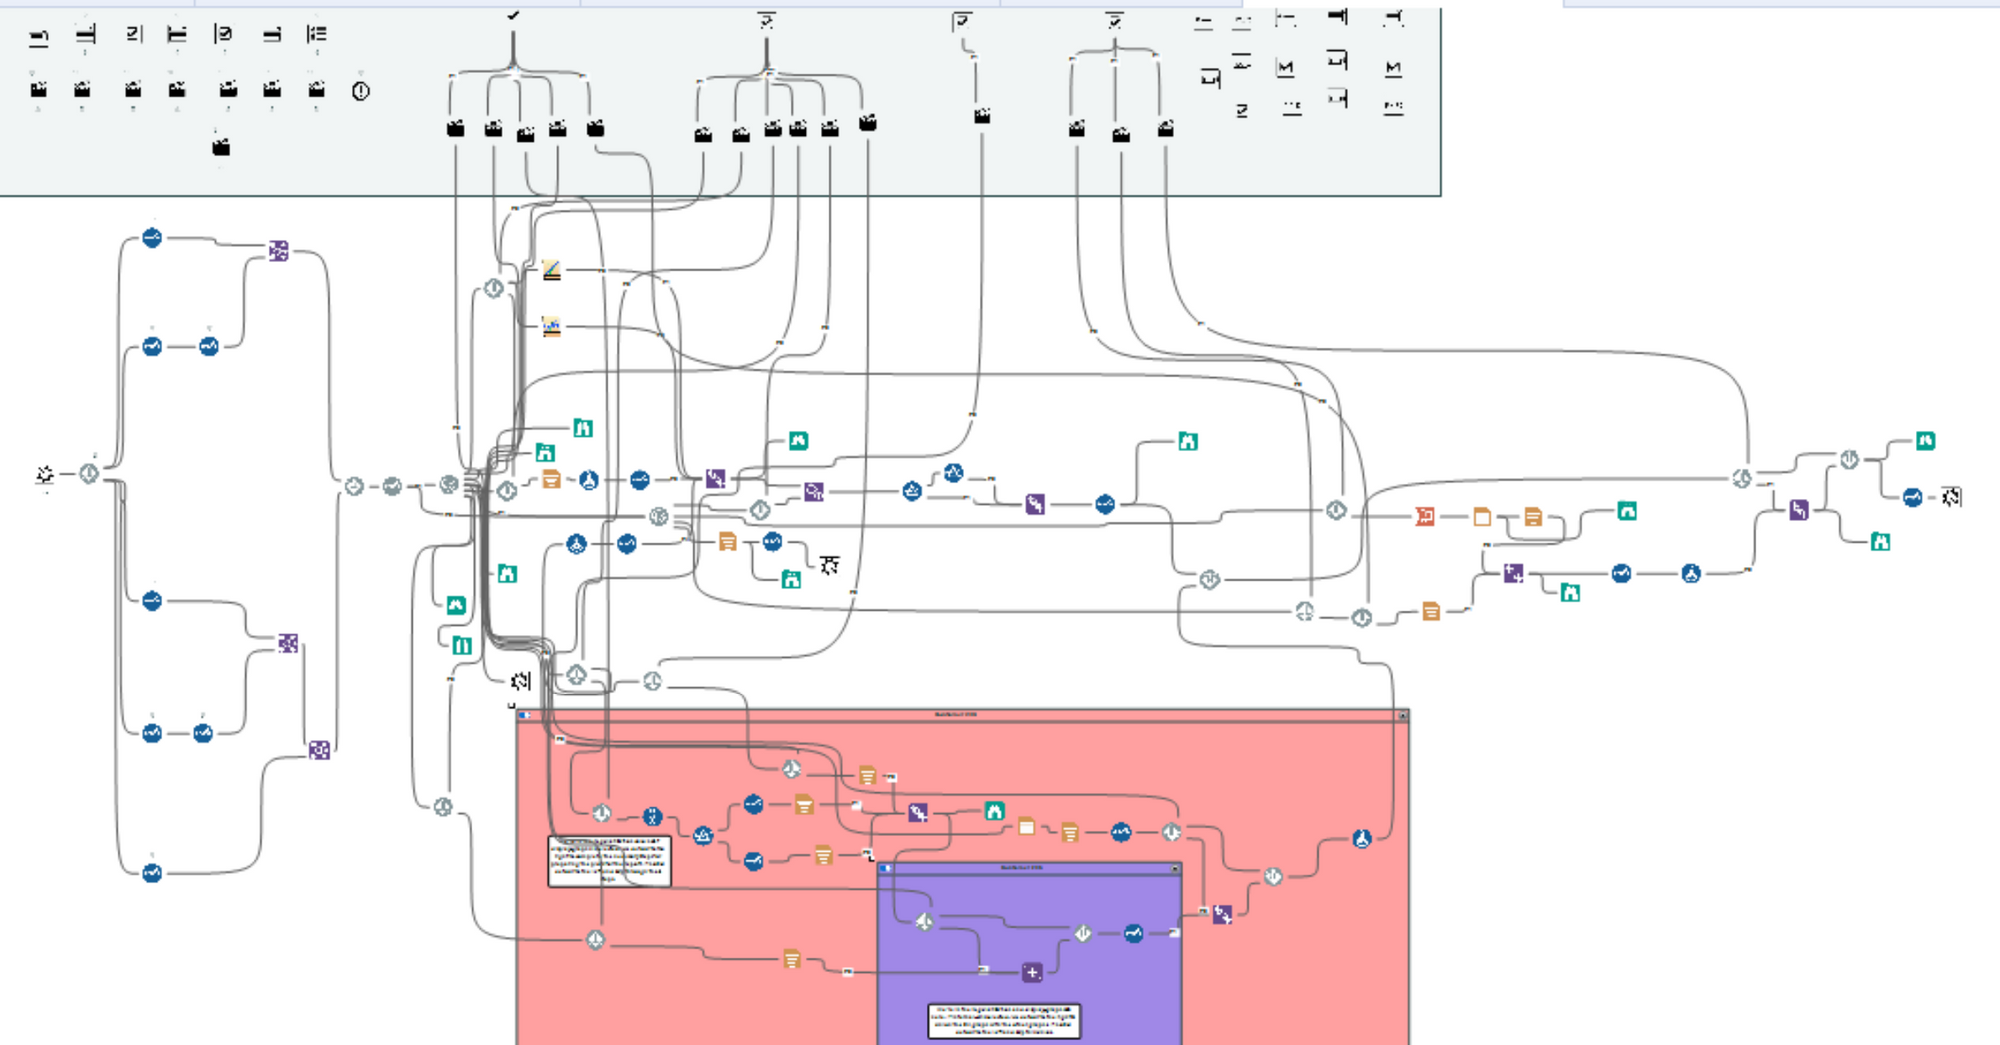
When I first decided I wanted to work in data, I started with an R coding course that primarily looked at coding a number of these models, so when starting with predictive tools in Alteryx, I wasn't starting from nothing. I was also pleasantly surprised with how much of the heavy lifting is done for you. That's because the linear regression tool is a macro, the terrifying inside of which can be seen below:
The goal of linear regression is simply to predict the value of a dependent variable based on a set of independent variables. In Alteryx, the configuration pane that we interact with thanks to that macro looks like this:
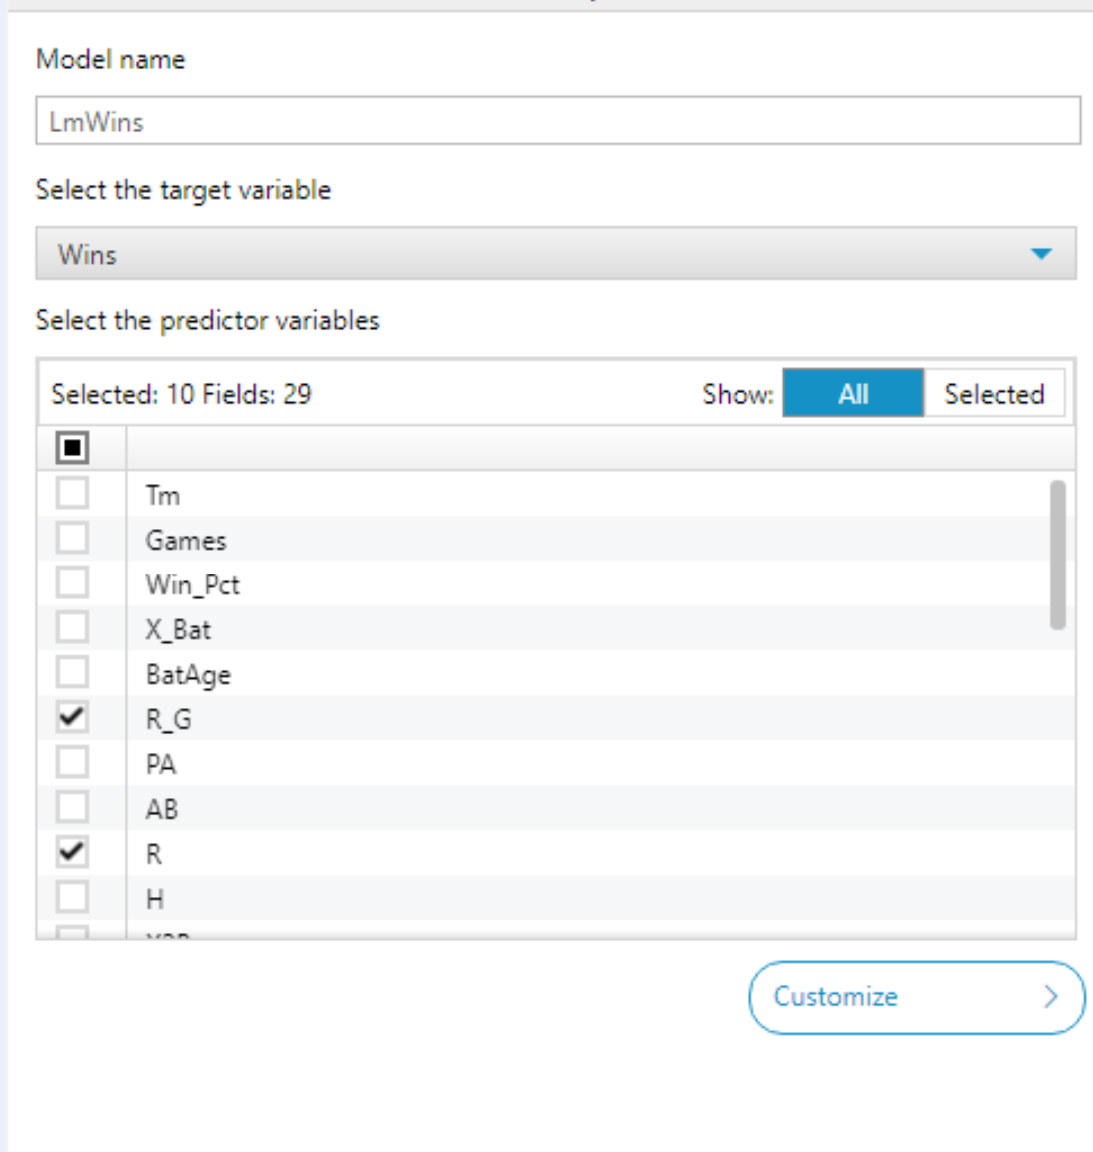
This example configuration pane is working off maybe the most famous popular culture example of linear regression there is. I'm referencing the baseball example that would end up being made into a movie - Moneyball (incidentally one of my favourite movies). The story revolves around using linear regression on baseball stats to find the most important independent variables to predict a dependent variable - wins.
You can call the model name whatever you like (just don't use any spaces).
Our target variable is our dependent variable that we're trying to predict, so in our baseball example - that's wins.
To predict wins using our independent variables, just tick the relevant boxes. How do you know which independent variables to choose? That can be more tricky and requires further investigation. I'll write another blog on that soon.