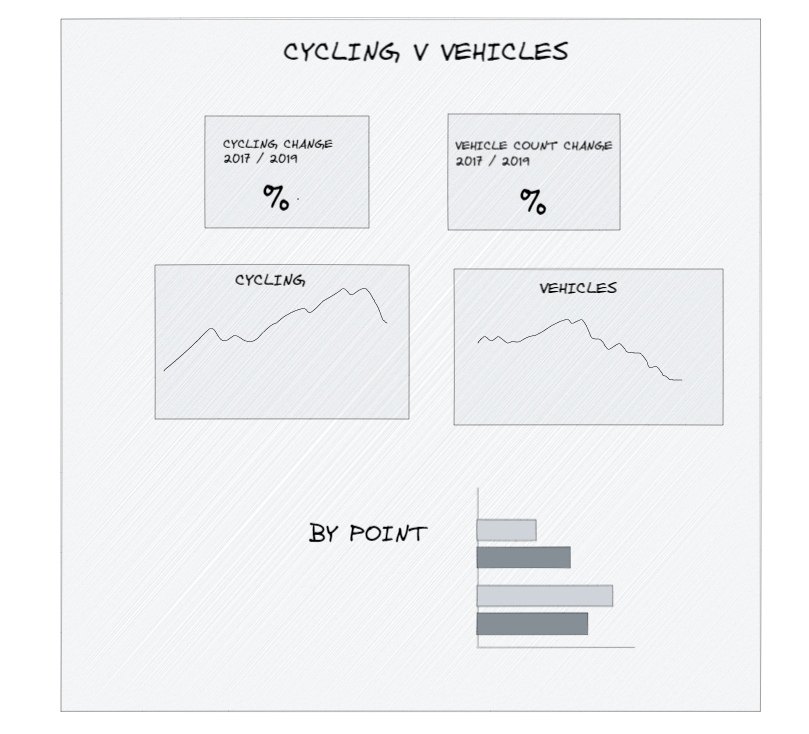
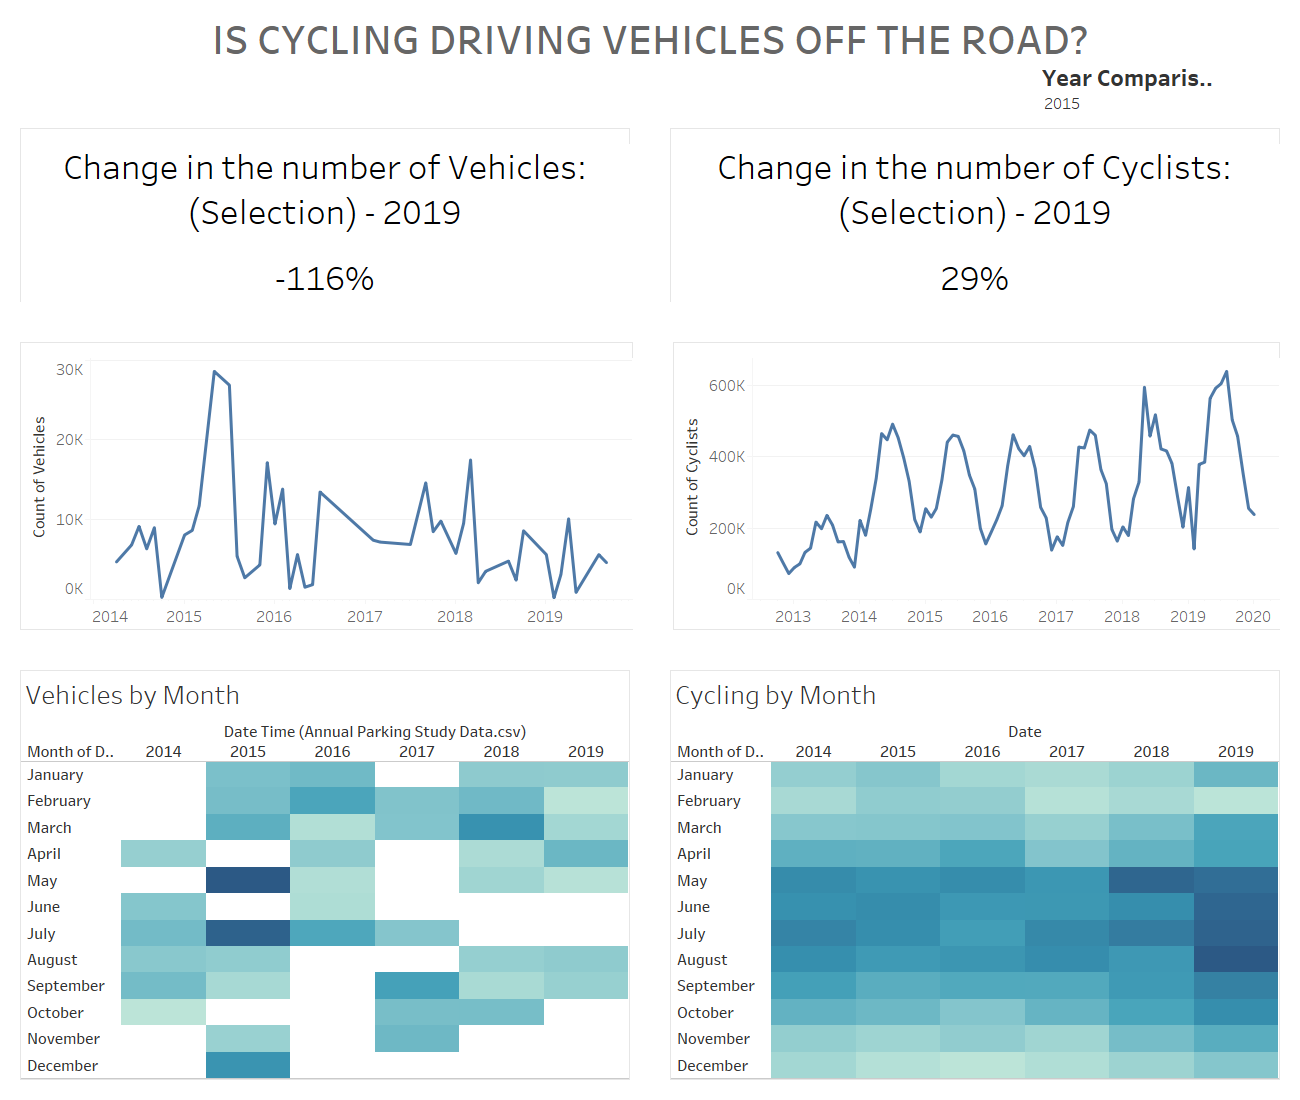
For todays challenge we were provided with a dataset containing all of the times a cyclist was flagged by Seattle's bike tracking software. This stretched back several years and required a lot of cleaning so I decided to jump onto Tableau Prep, having used Alteryx for the two previous days. The Prep was a little challenging as it required some transformations so it could be unioned.

The prep flow didn't take to many steps, but the logic behind it meant that even though the 12 excel files has different column names or the same format, they could be unioned and turned into a single dataset. I also removed some of the data as it contained information on when it counted a pedestrian. This also meant that I had to create my own totals to represent just the bike parts. The next stage involved finding a new data set to join to this, as I wanted to explore something new. The data I found looked at the count of vehicles within the Seattle area, and I thought this would be interesting to explore as a possible correlation between the increase in cycling. I initially wanted to use spacial tools to work out the vehicle counts around the locations of the bike sensors and tried to build this in Alteryx. Unfortunately the street naming conventions in the data I downloaded didn't have any consistency with the spacial file, so I decided to ignore this and focus on a higher level of analysis. The next problem was that the date formatting on the spreadsheet was clashing with Tableau and leading to a lot of null data. Once this problem was solved I started to build it out in Tableau.

The second challenge we were given was to build this in Tableau web editor on the Public site. The first issue I had was in creating a Relationship model between the two data sets. Tableau kept on erroring when I brought in the second data set and then failing to create the extract when it would join. After specifying the data path manually, the model started to work. This was when I found out about the problem with the dates changing in Tableau, and required some troubleshooting to fix. The issue with troubleshooting in web editor was that I had to refresh the relationship model which resulted in more erroring. Web editor also misses a few intuitive design elements in Desktop, so it took some getting used to. ALWAYS PUBLISH when working in web editor as you build as a crash can result in lost work. Fortunately I had done this when it crashed on me but it could have been a big problem. Overall I enjoyed exploring this dataset, however I ran into a lot of problems over the way which took a while to fix. This cut into my dashboard building time, but I think it still points out some interesting analysis to take forward. I would have liked to have explored some more spacial analysis, however this can take a while to work out and has proven difficult to explore with the time limit.

