


Day 5 was the culmination of the two-day NFL Big Data Bowl challenge. With the data preparation largely complete, the primary focus shifted entirely to the build phase, transforming the raw analysis into a polished, insightful dashboard.
1. Design Strategy and Initial Build
The first task was translating the analytical requirements into an appealing and functional dashboard. A strong focus was placed on enhancing design skills, leading to a deliberate strategy of creating an app-like user interface.
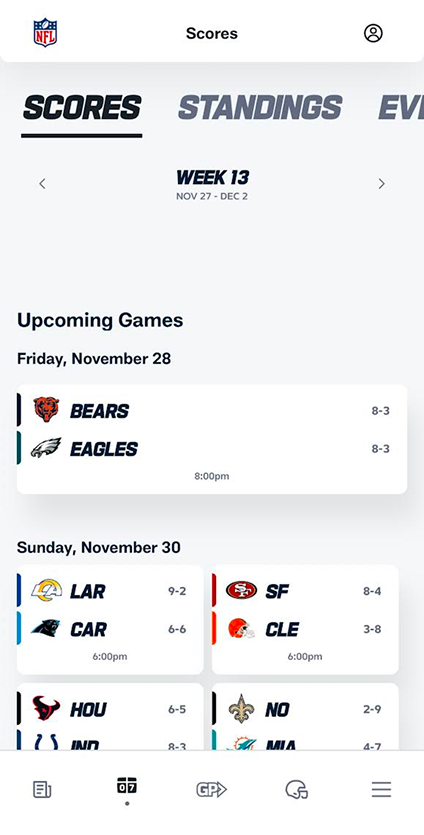
- Inspiration: The design was heavily inspired by the look and feel of the official NFL mobile app and website (see inspiration image below).
- Template: Similar fonts, color schemes, and rounded edges were integrated into a custom background image, giving the dashboard a modern, sleek appearance.
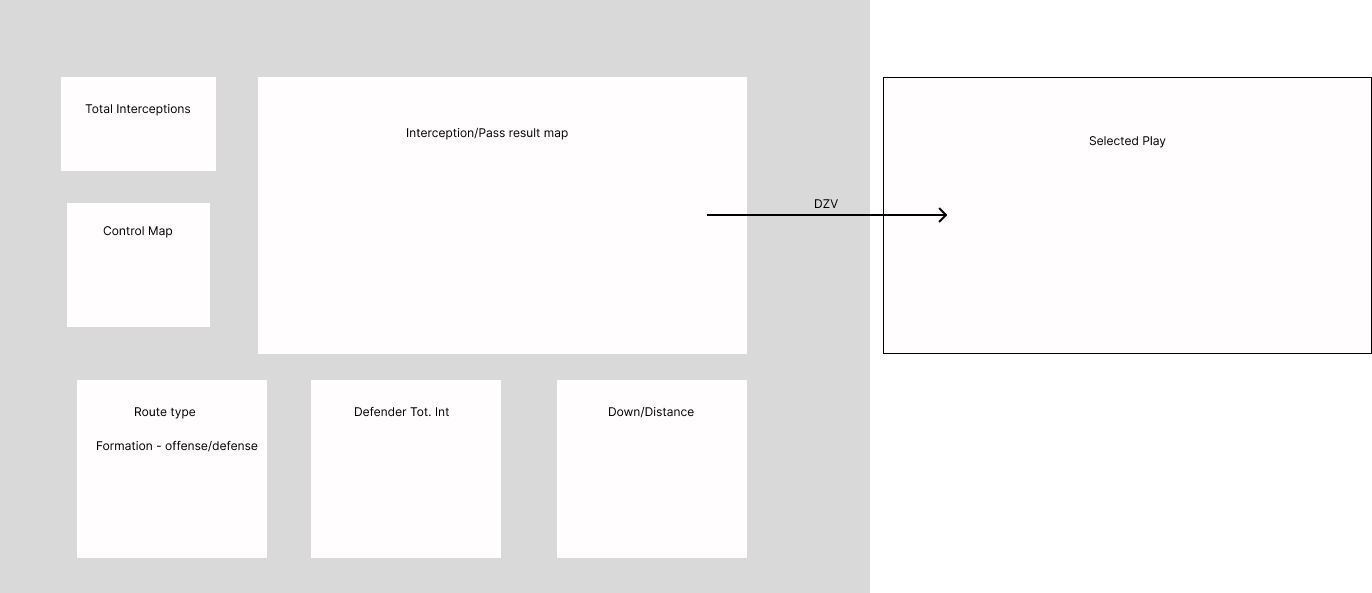
- Interactivity: Navigation was implemented using dynamic zone visibility within Tableau, where custom sheets act as 'buttons,' changing a parameter value to dynamically show or hide different sections of the dashboard.
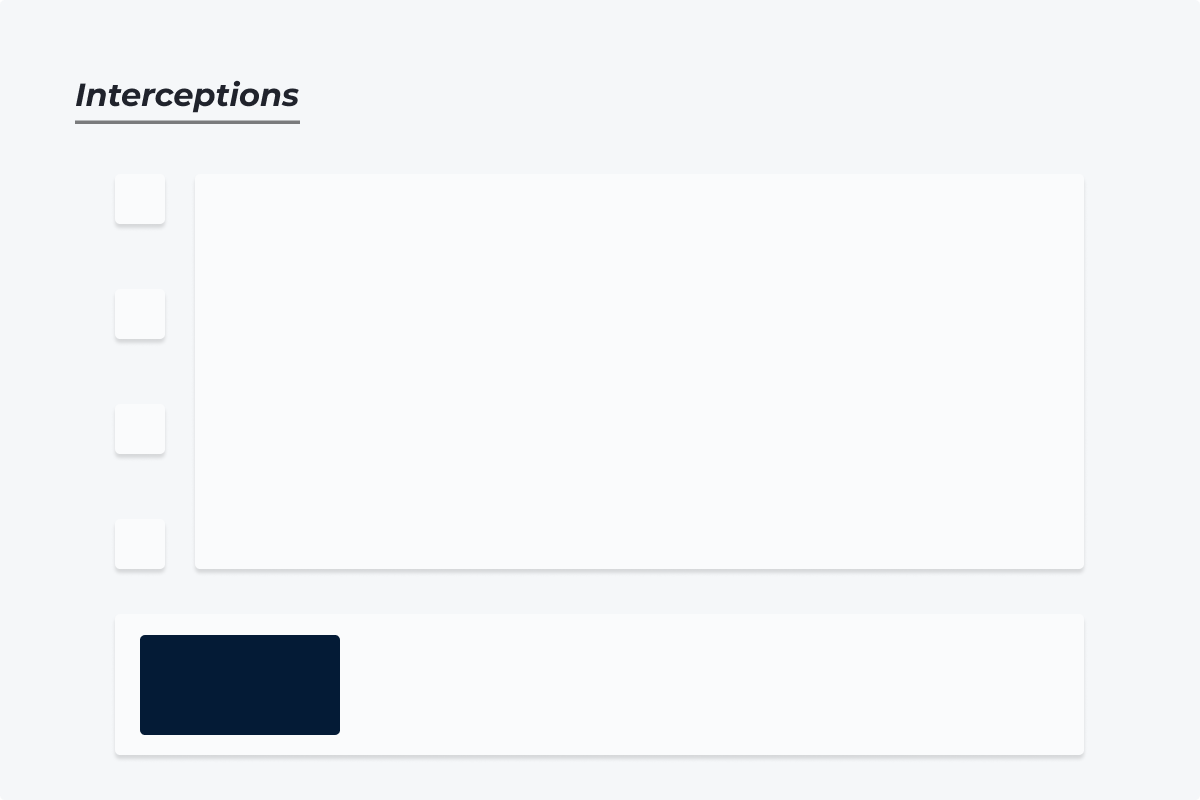
The initial build successfully combined various charts reflecting the planned analysis (e.g., total interceptions, route type, down and distance) into a unified view.

2. The Feedback Loop: Iteration is Key
After the initial submission, crucial feedback was received that focused not on the analysis, but on usability and layout.
Key Feedback Points:
- Layout Swap: The lower section, which contained key summary information (like total interceptions), needed to be moved to the top to establish context.
- Space Allocation: Redistributing space to allow more area for charts would improve data visibility.
- User Instructions: More explicit instructions were required on how to use the dashboard's interactive features.
3. Final Changes and Improvements
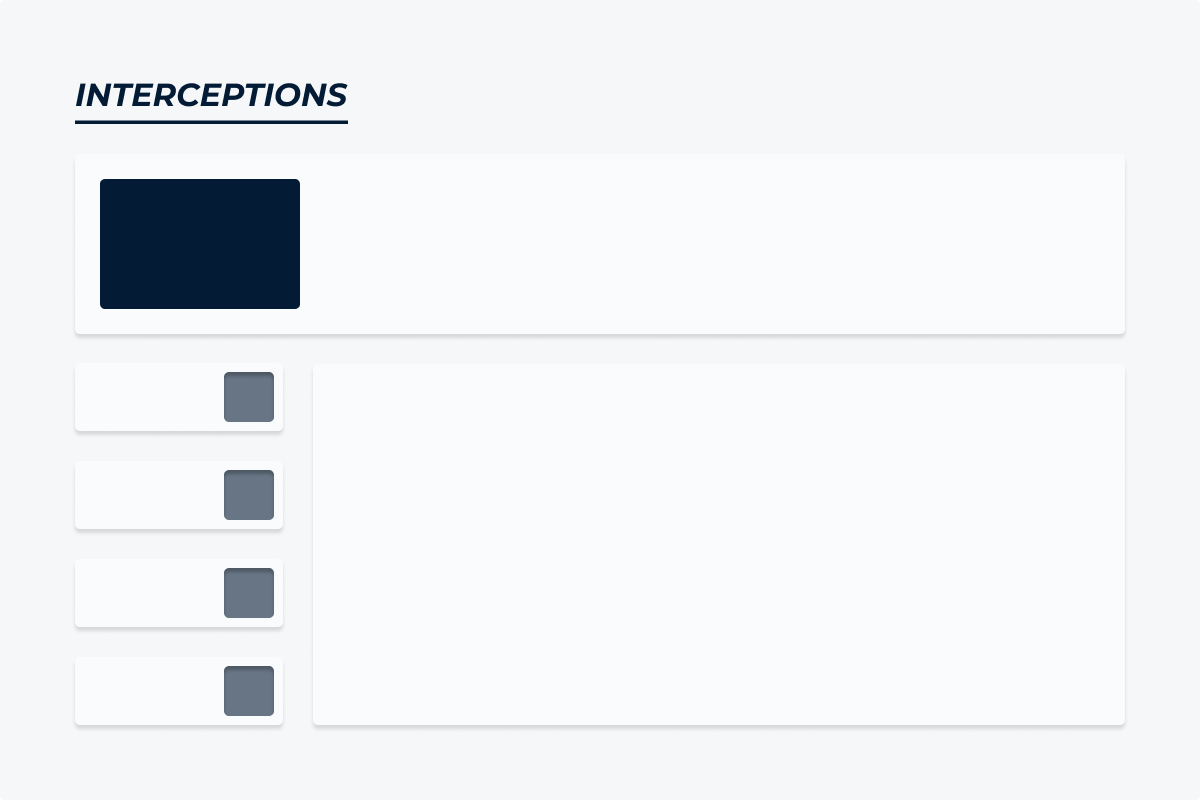
The dashboard was updated to reflect the feedback, resulting in an improved and more user-friendly V2.
- Layout Implemented: The layout of the dashboard was swapped to position key information and controls at the top, following the feedback on information hierarchy.
- Data Scope Expansion: The initial dashboard was built only with Week 1 data for testing. This was expanded to include every regular season game week, and a game week filter was integrated to allow users to filter the data.
- KPI Integration: The game week filter was linked to the Total Interceptions KPI, making the metric dynamic and responsive to user selections.
- Detail Enhancement: Tooltips were refined to provide greater analytical detail for users drilling into the charts.

The iterative process underscored the importance of integrating user-centered design principles with technical analysis. The final dashboard is cleaner, more intuitive, and fully addresses the competitive goal of communicating player movement insights effectively.