Recently, I was tasked with exploring Tableau Next, the platform's vision for the future of analytics. Tableau describes Next as "a flexible, API-first analytics experience... Built on a composable architecture, with a unified data layer and trusted semantics, it delivers personalised, contextual, and actionable insights to every user."
It leverages AI features like Tableau Semantics and integration with Salesforce's Data Cloud to simplify business analytics. The core value proposition is introducing a common semantic foundation, allowing metrics and charts to be created once and reused, driving consistency and reducing complexity.
The main abilities promised by Tableau Next include:
- A unified data layer and semantic model.
- Prebuilt analytics and visualisation templates.
- Natural language–powered agents.
- End-to-end governance and reuse.
Challenge: Cohort Sales Analysis
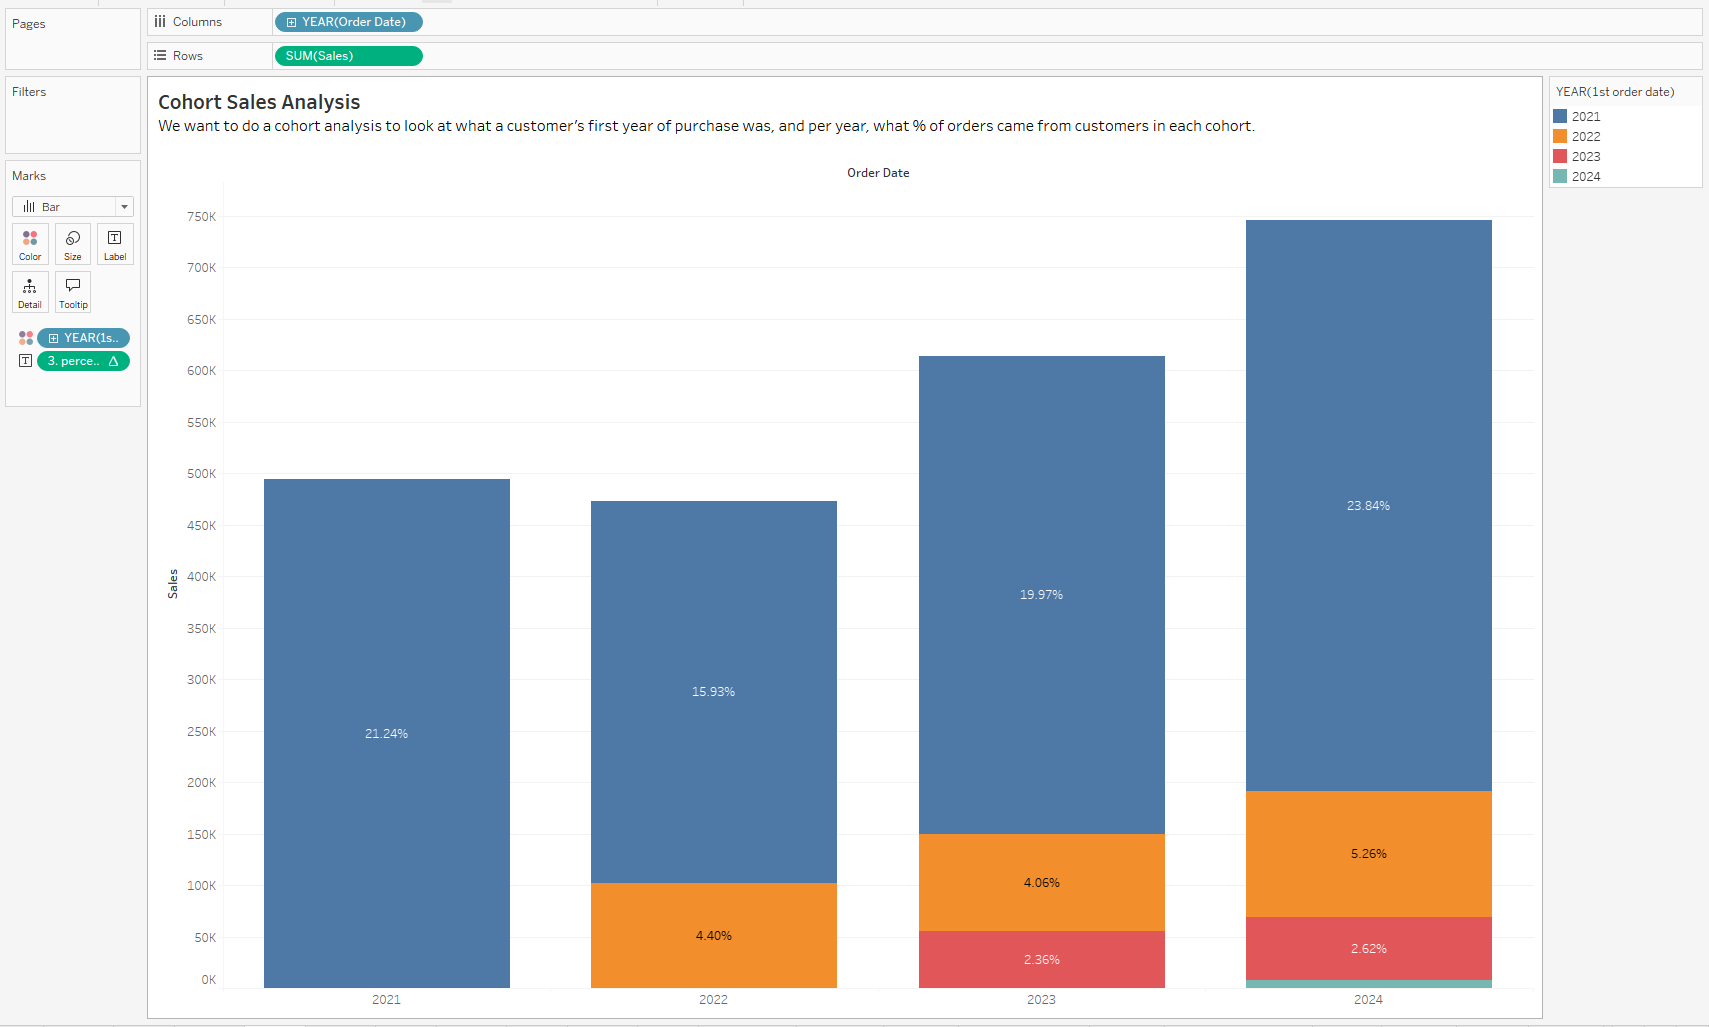
While exploring its capabilities, I attempted to build a common, complex visualisation: a cohort sales analysis. The goal was to show, for each customer cohort (defined by their first purchase year), what percentage of total orders that cohort accounted for in all subsequent years. (see the chart built in Tableau Desktop below)
Step 1: Defining the Cohort
The first step was defining the cohort year using a Level of Detail (LOD) expression. This calculation finds the minimum (first) order date for every customer.
First Order Date = { FIXED, [Customer Name] : MIN([Order Date])
⚠️ Naming Caution: It was noted that calculation names in Tableau Next must start with a letter (e.g., attempting to name the field 1st Order Date resulted in an error message).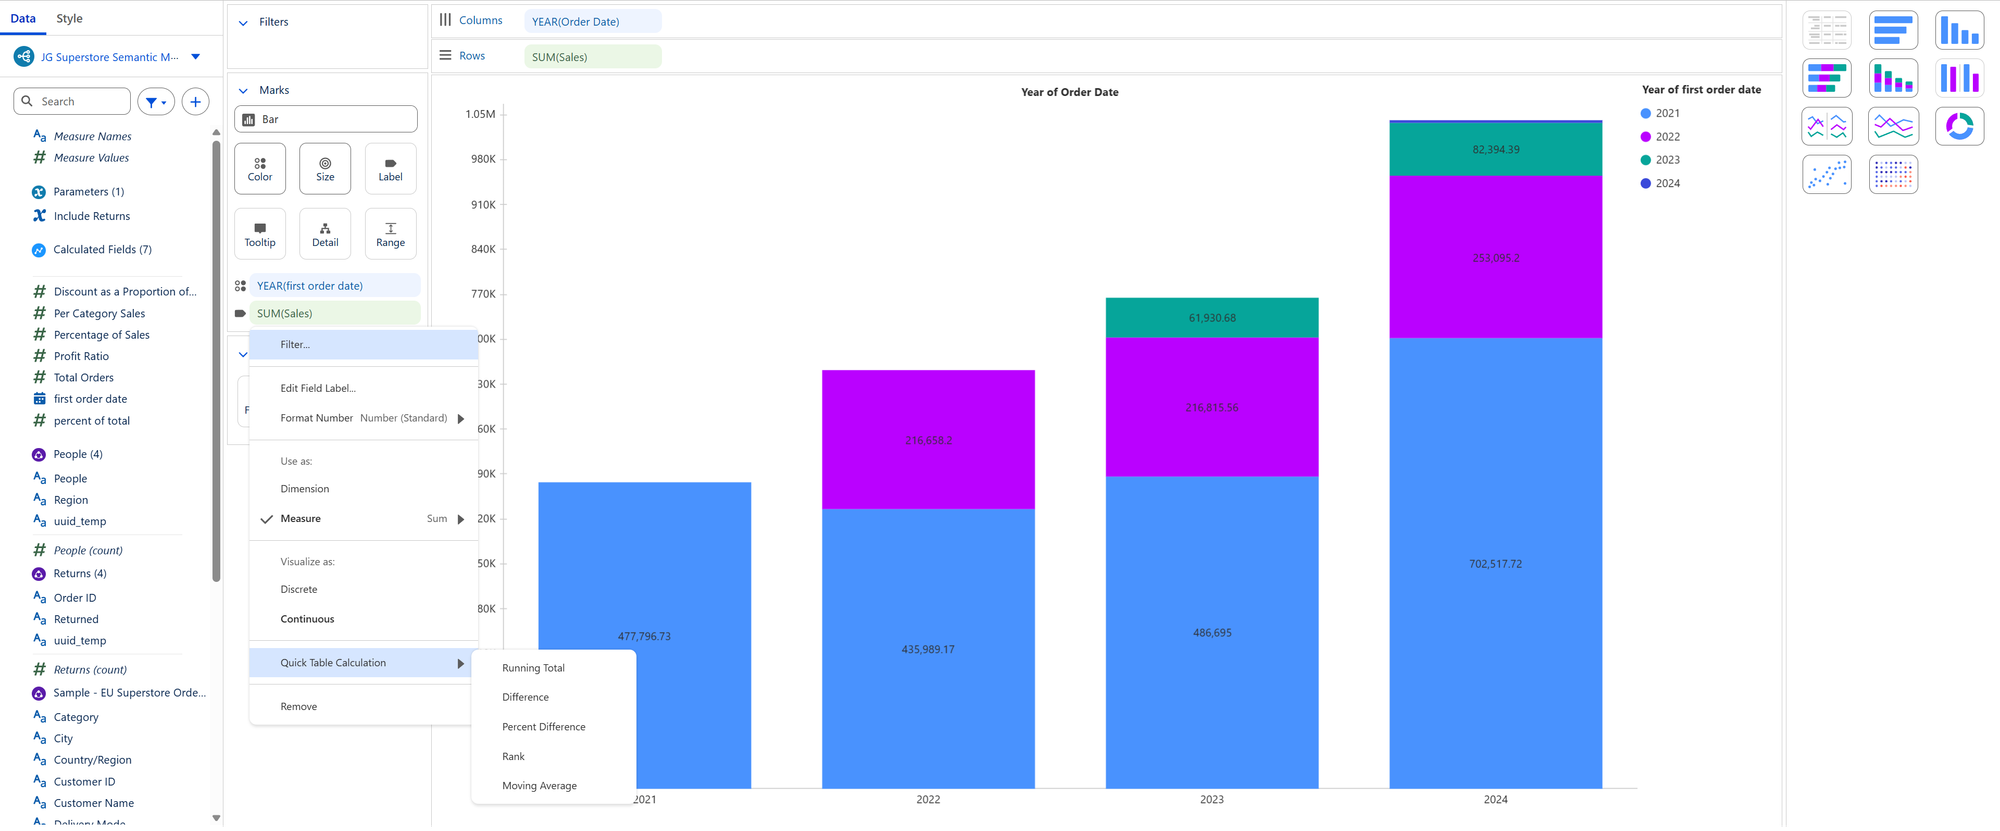
Step 2: The Table Calculation Limitation
The bar chart was built successfully, but the critical step, labeling each bar with its "Percentage of Total", revealed a limitation compared to the full Tableau Desktop experience.
In Tableau Desktop, a rich set of Quick Table Calculations is available, including Percent of Total.
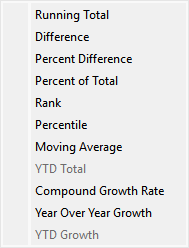
However, in Tableau Next, the available Quick Table Calculations were limited to:
Running TotalDifferencePercent DifferenceRankMoving Average
The essential Percent of Total was missing.
Overcoming the Limitation: Custom Calculation Fails
To overcome the missing quick calculation, the next logical step was to build the percentage calculation manually:
Percentage of Total = SUM([Sales])/TOTAL(SUM([Sales]))
This calculation was placed on the Label shelf. However, the resulting percentages were incorrect. In standard Tableau, the "Edit Table Calculation" window allows you to define the scope and direction (e.g., "Compute Using: Table (Down)" or "Specific Dimensions") to ensure the calculation correctly divides sales by the total across the entire year.
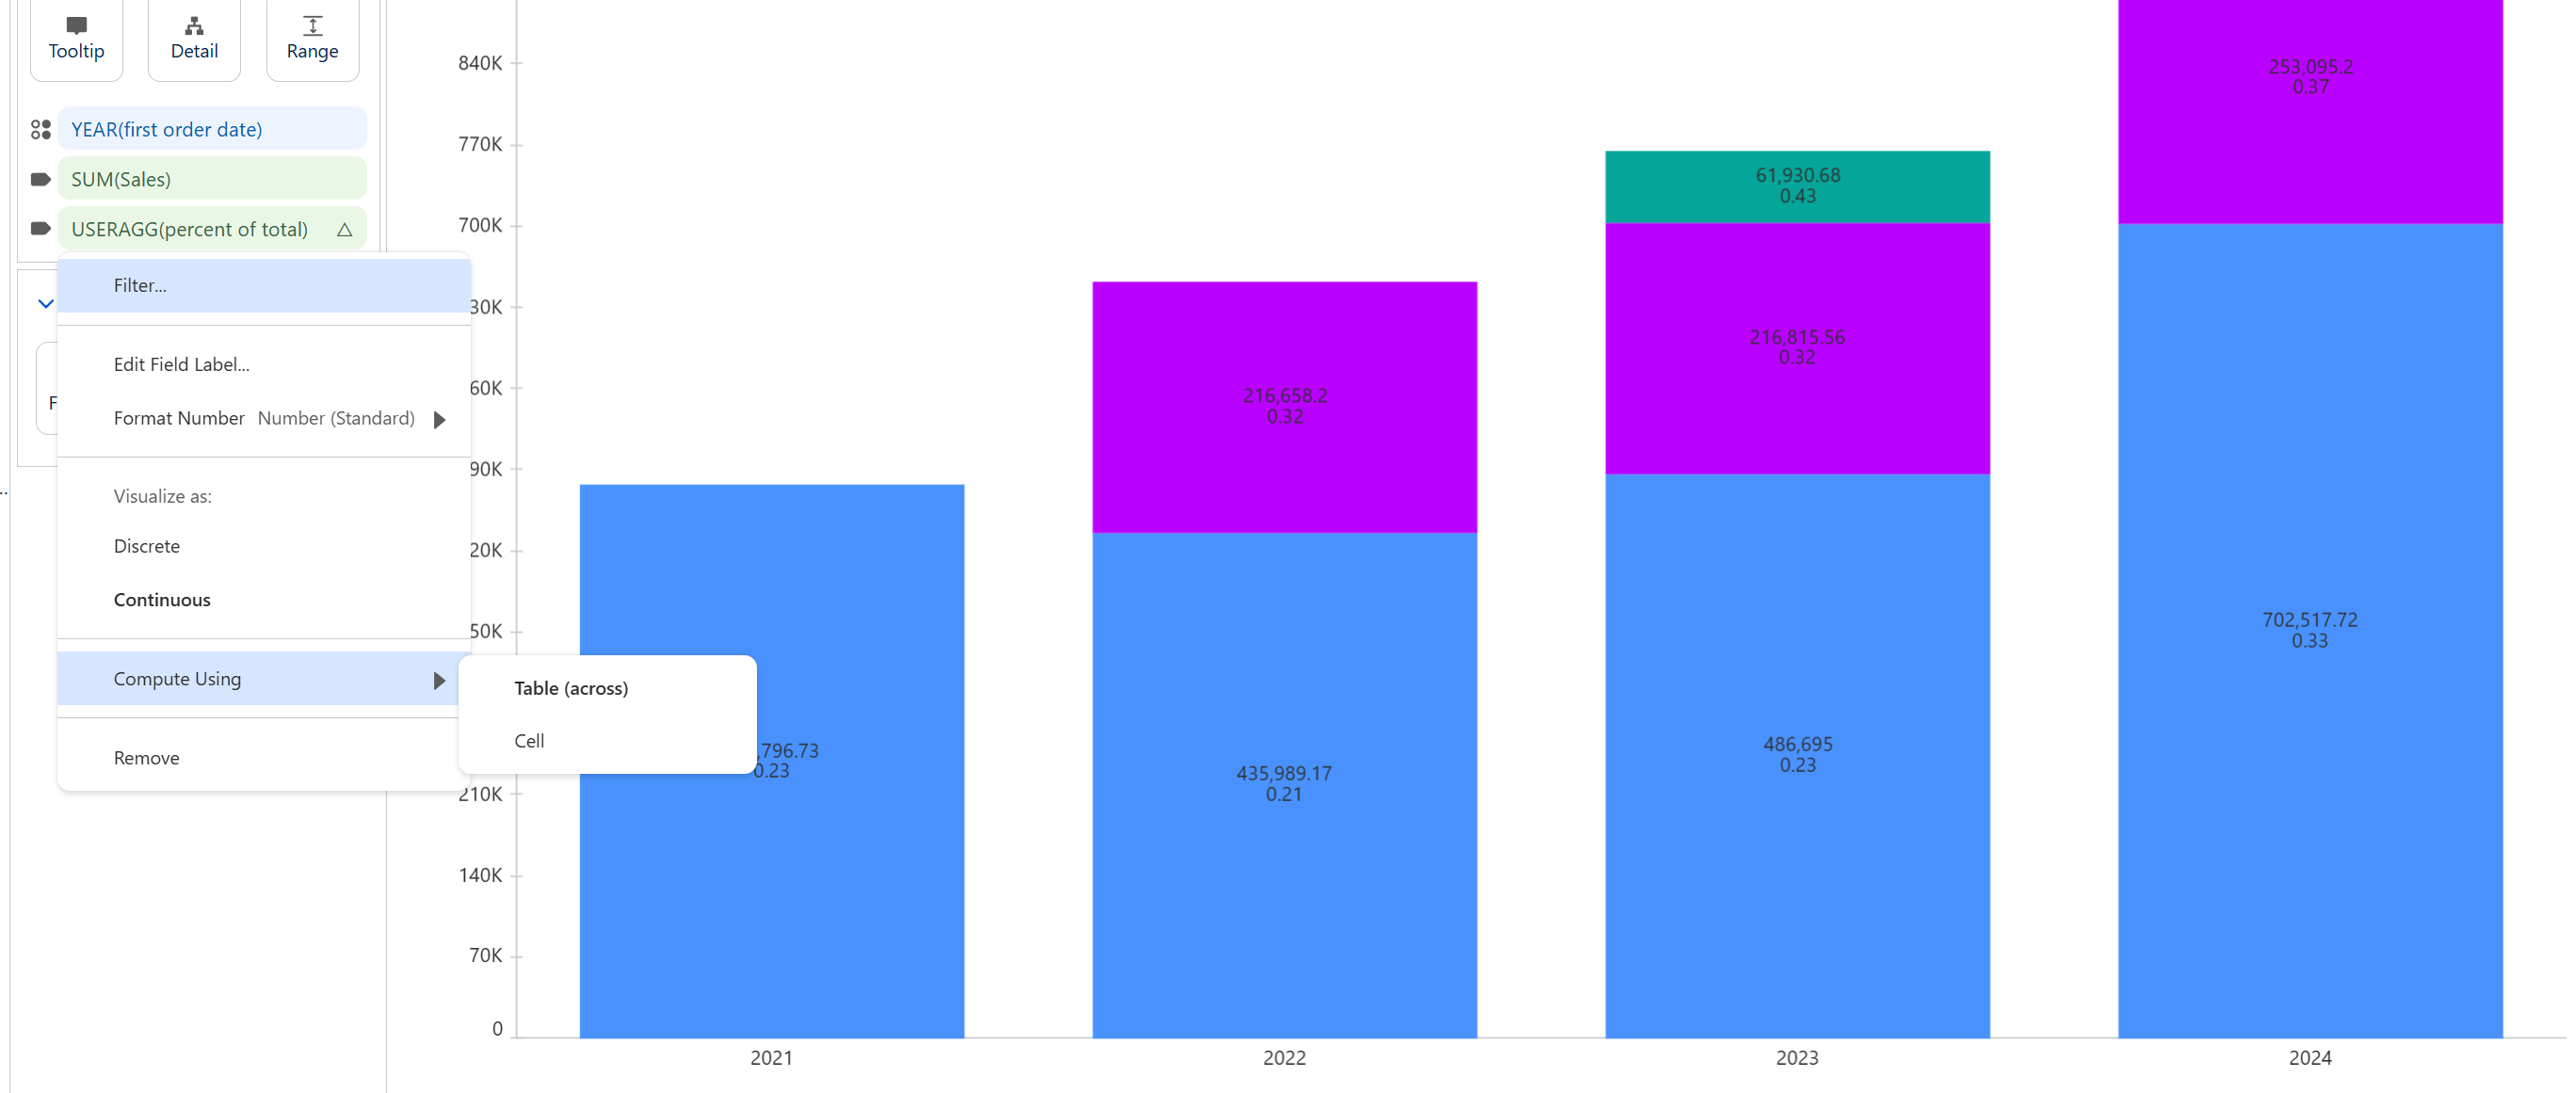
In Tableau Next, the ability to adjust the table calculation was highly restricted.
The only available compute options were Table (across) and Cell. This prevented the necessary adjustment to compute the percentage of total sales for the cohort per year, effectively making the cohort analysis percentage incorrect and highlighting a significant current limitation in Tableau Next's advanced analytical capabilities compared to Tableau Desktop.