The CALCULATE function allows you to compute by groups, with options to filter within the function.
Using the CALCULATE function in Power BI can be viewed as a combination of aggregation (or Group By in Power Query) and joining.
Understanding the syntax of CALCULATE
The CALCULATE function is of the form
CALCULATE([Aggregated Field], [Filter Expression 1], [Filter Expression 2], ...)
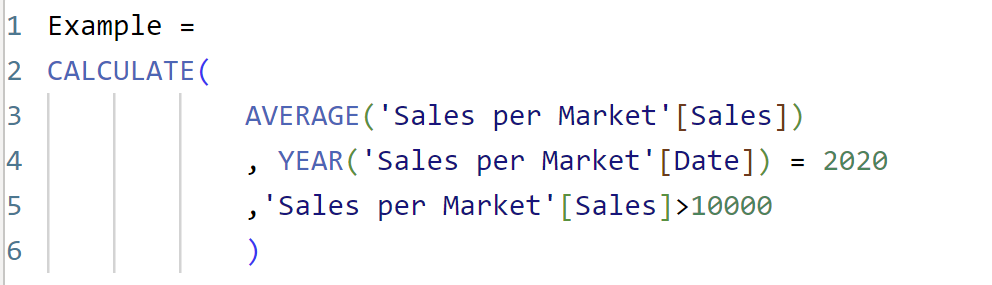
The aggregated field can be SUM([Sales]), AVERAGE([Sales]), or any other summarisation expression. You can input as many filter expressions as you want, which must be Boolean, for example YEAR([Date])=2020, [Sales]>10000.
CALCULATE then computes the aggregation over what is in the view combined with the additional filters expressions applied on a row-level.
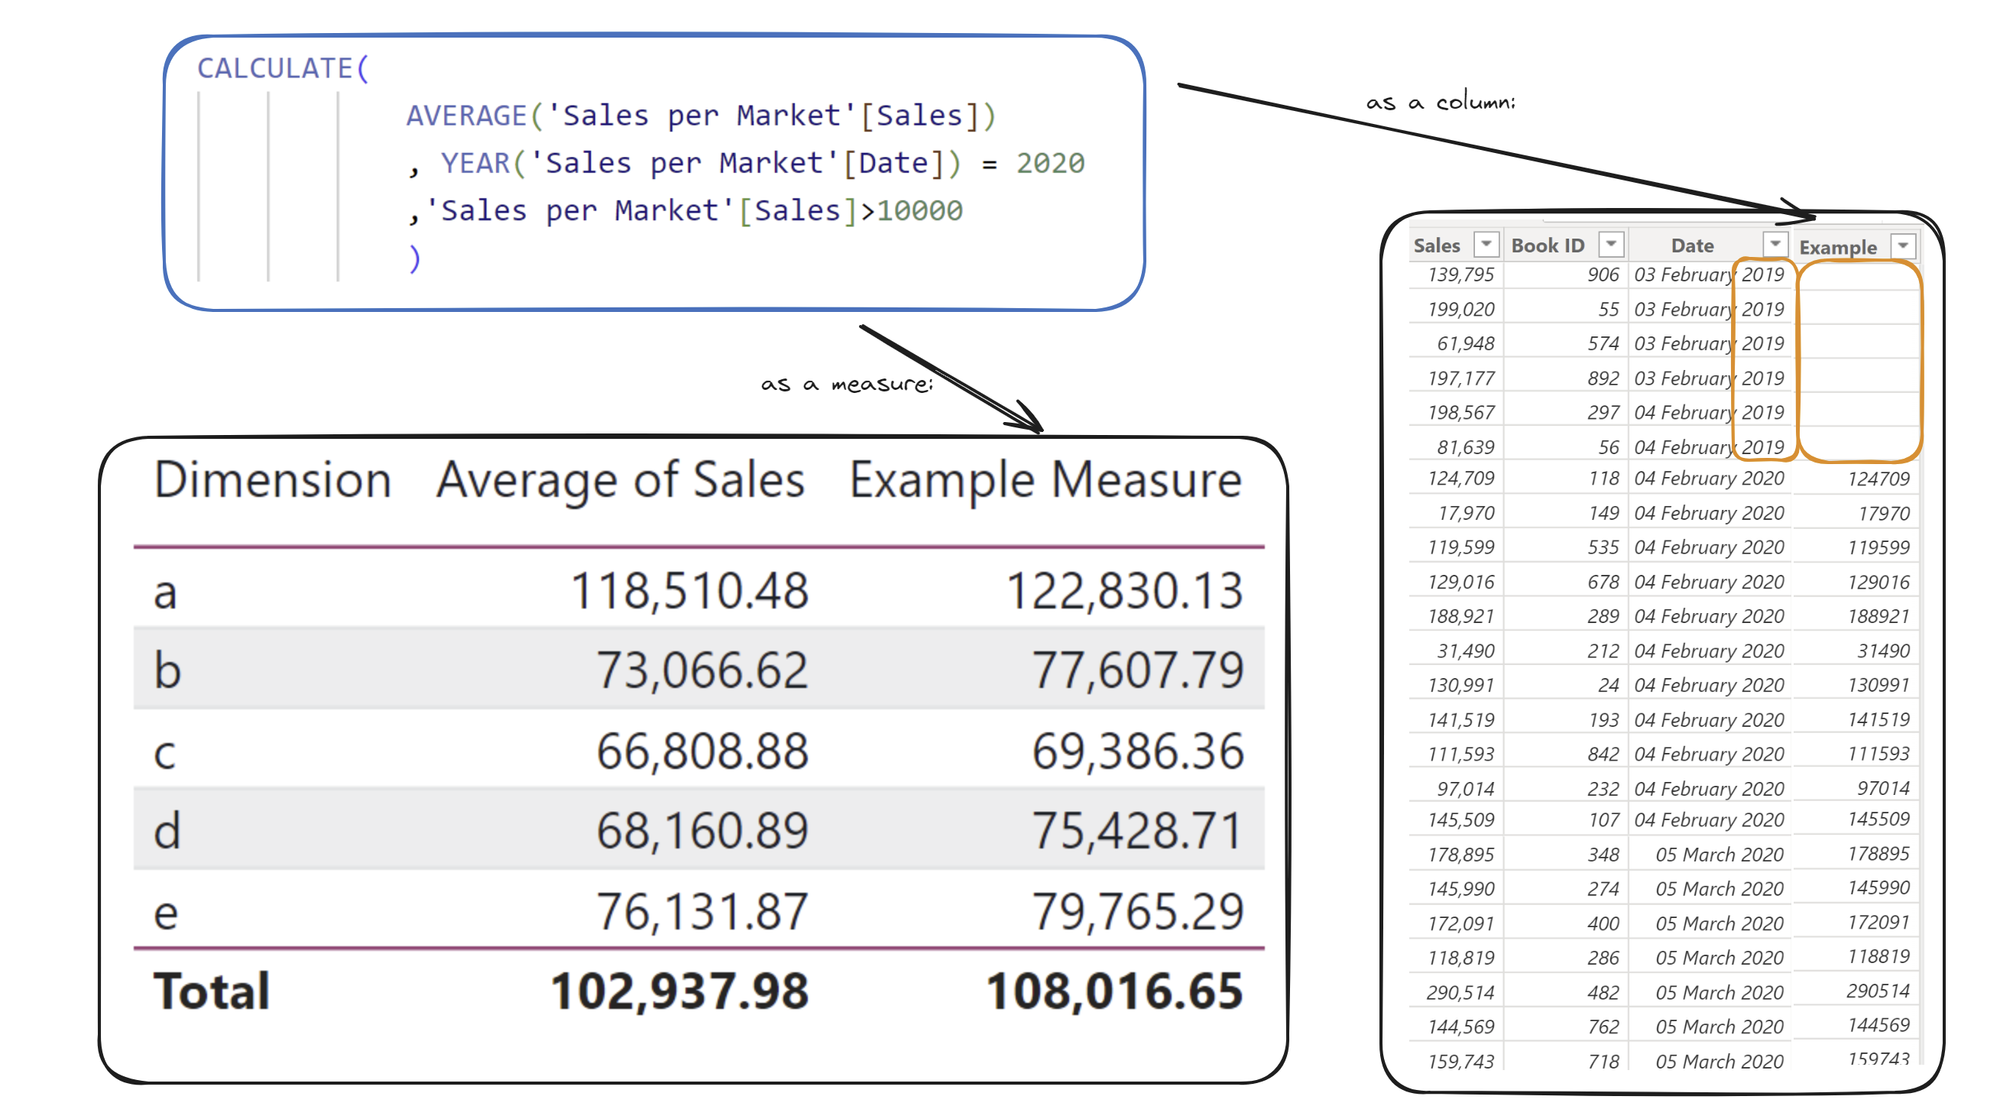
The CALCULATE example on the left (as a Measure) is computing the average of [Sales] over 10,000 in 2020 for each [Dimension], since [Dimension] is in the view.
The CALCULATE example on the right (as a Column) is outputting the row-level [Sales] whenever it is above 10,000 and the year is 2020. This is because all rows are on the view - the average of a single data value is itself!
To have more control over what is computed, you can add filter functions in the filter arguments of CALCULATE.
Understanding the filter functions REMOVEFILTERS(), ALL(), and ALLEXCEPT()
The CALCULATE function accepts more than just row-level filters. Filter functions such as REMOVEFILTERS(), ALL(), and ALLEXCEPT() work by forcing a different level of detail for which to compute over.
The easiest way to understand this is in terms of aggregation (called Group By in Power Query) and joining.
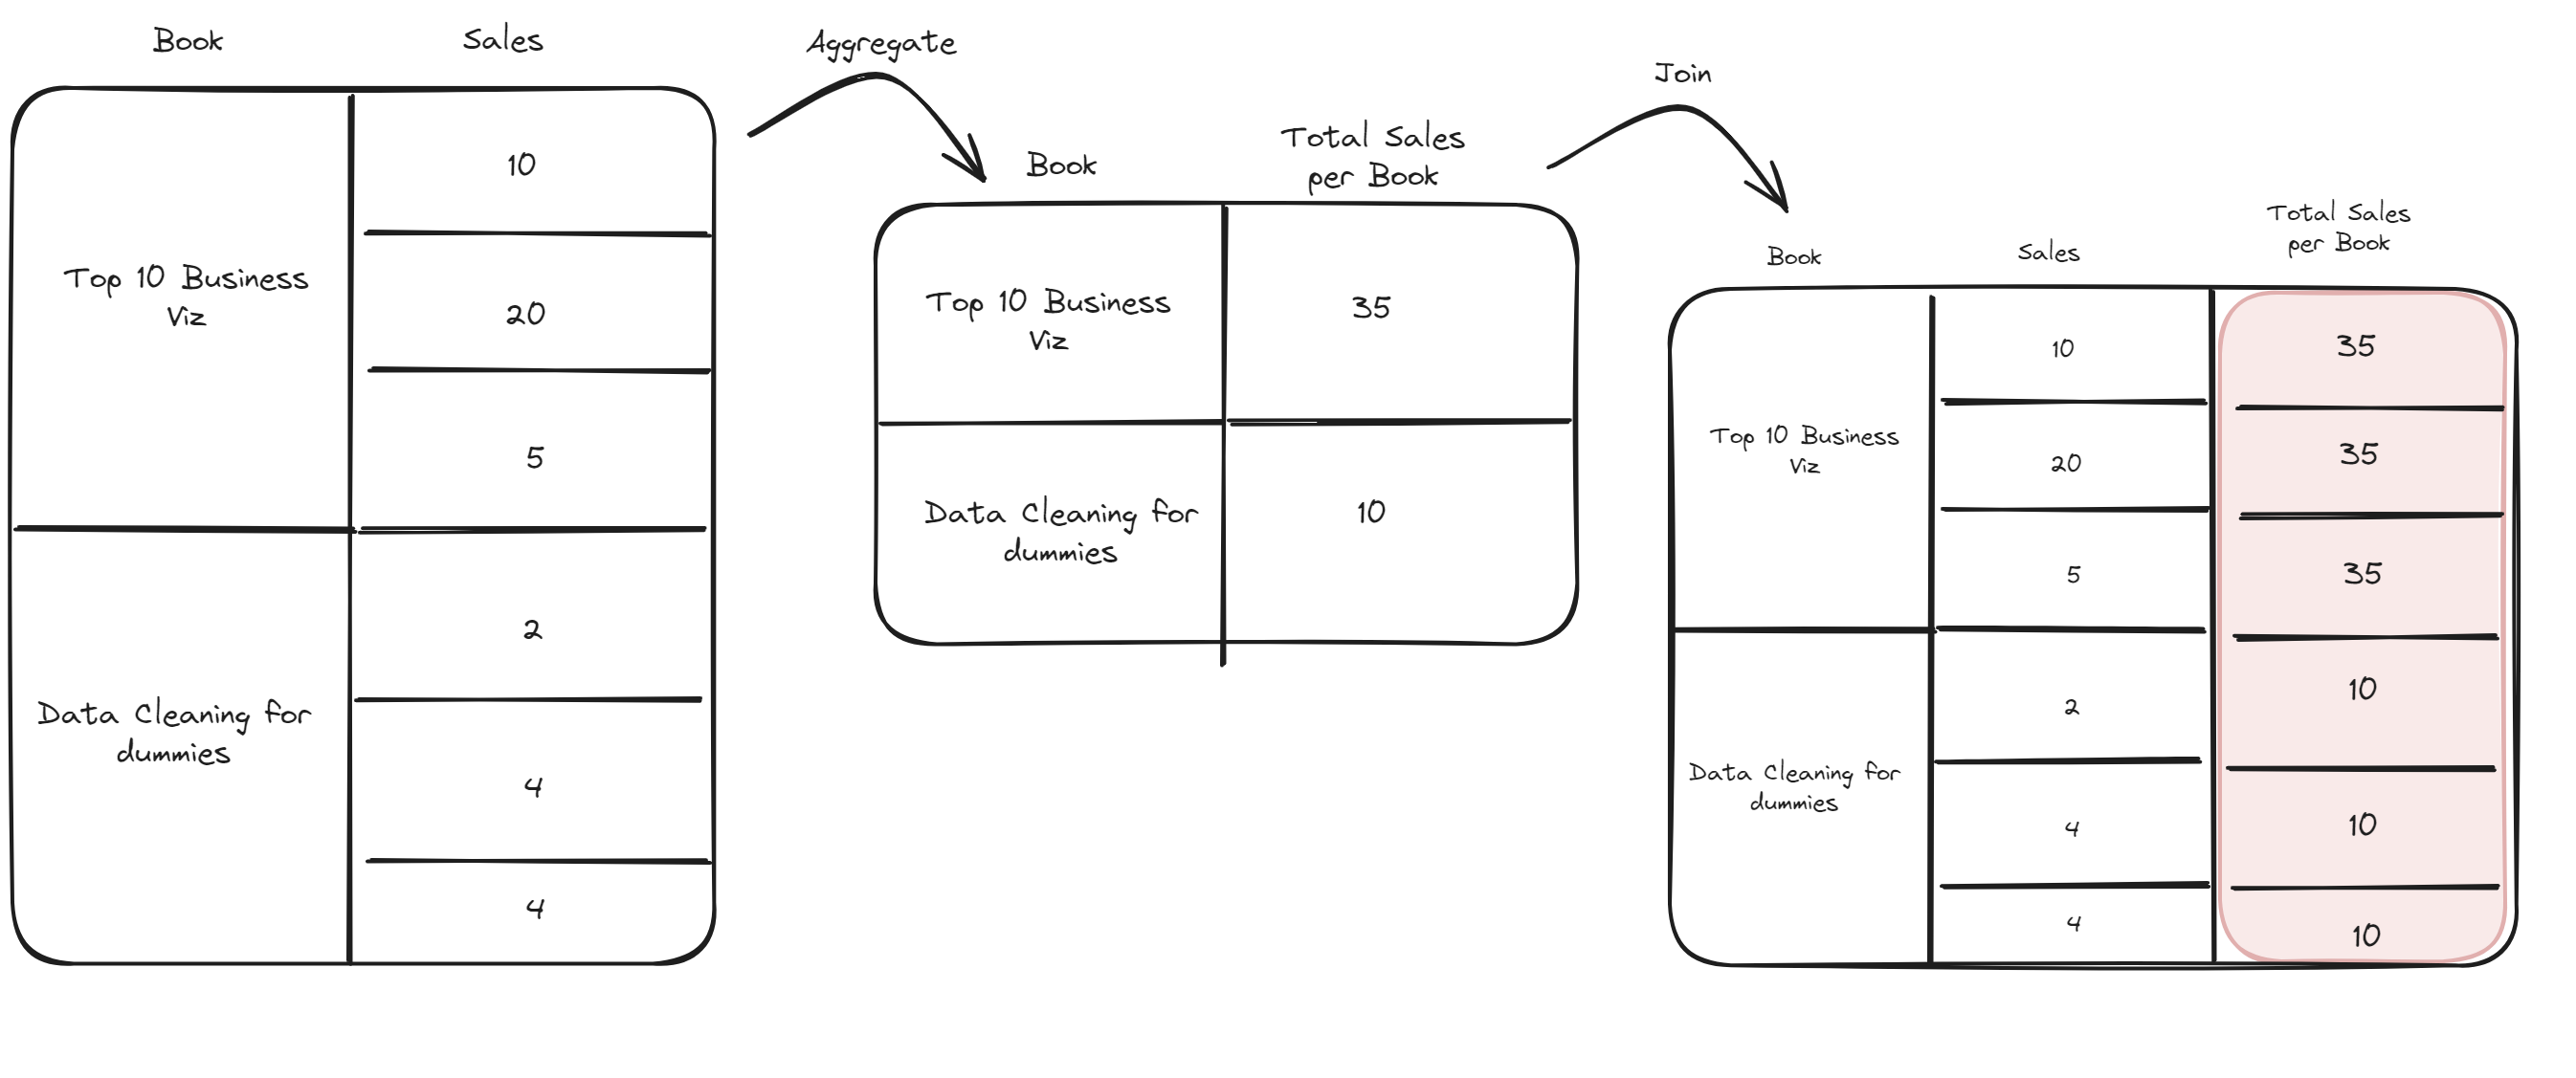
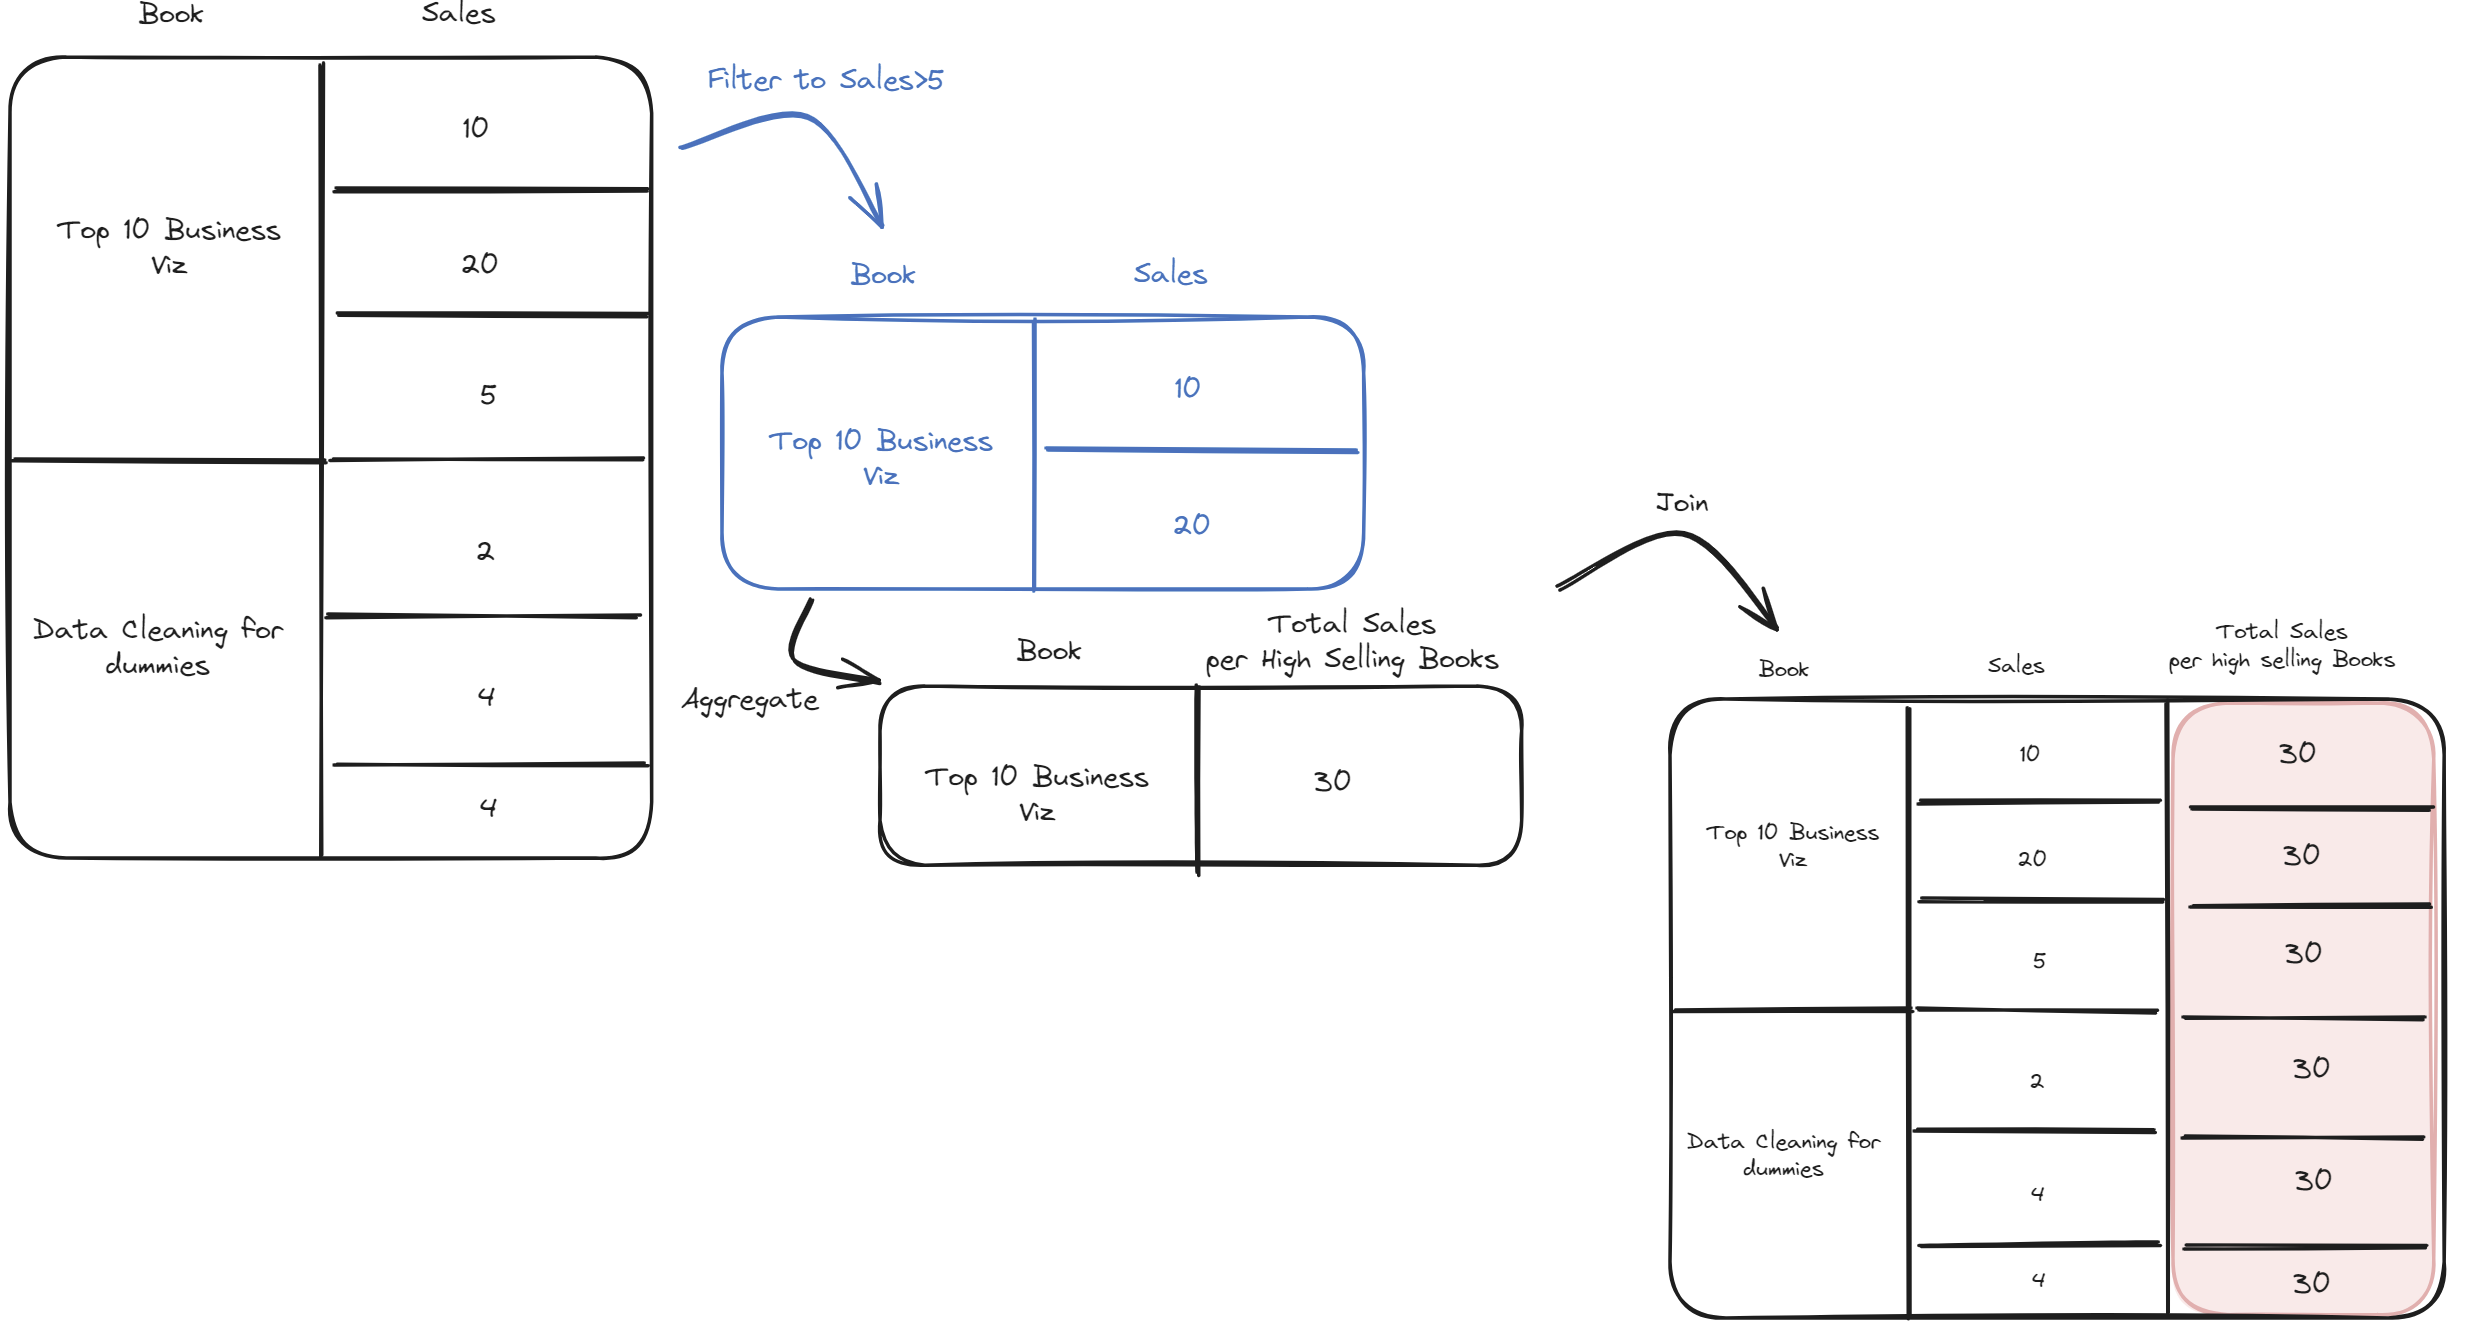
The above sketch is showing how you might go about attaching total sales per book alongside each individual book sale. The aggregate step would be grouping by [Book], aggregating [Sales] by summing. This is followed by joining on the grouped field [Book].
This could have been replaced with a single CALCULATE function with the following interpretation of syntax:
CALCULATE([Aggregated Field], ALLEXCEPT([Grouped by Fields]))
In the case of the example, the aggregated field is SUM([Sales]), and the grouped by field is [Book]. Note that the ALLEXCEPT function requires the table name before the grouped by field.
With this interpretation of the syntax, REMOVEFILTERS() and ALL() both act as if you are not adding any fields to Grouped By, i.e. you are aggregating the entire dataset to one row (and then joining it back onto the original dataset).
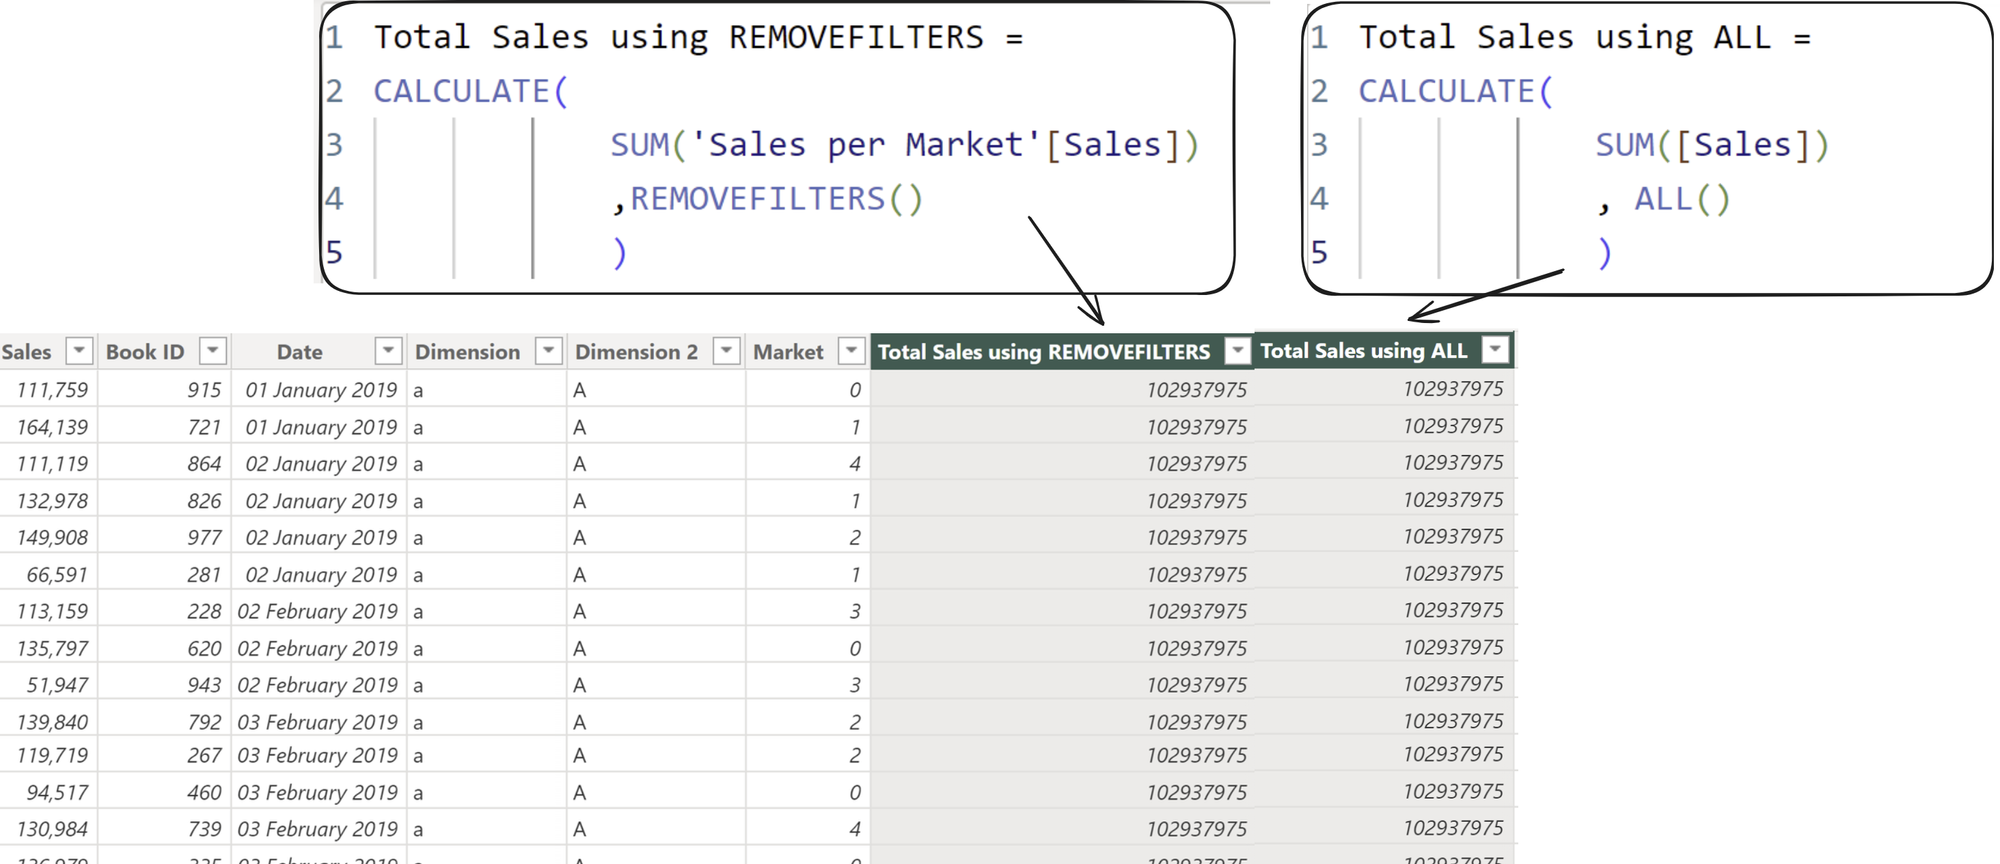
Both of the Total Sales columns in the picture show the total sales over the whole dataset - Grouping by nothing and using the aggregated field SUM([Sales]) adds together all of the sales in the data. Note that the same numbers would appear here if you were to use CALCULATE as a measure.
If instead you wanted total sales per year, ALLEXCEPT is more appropriate:
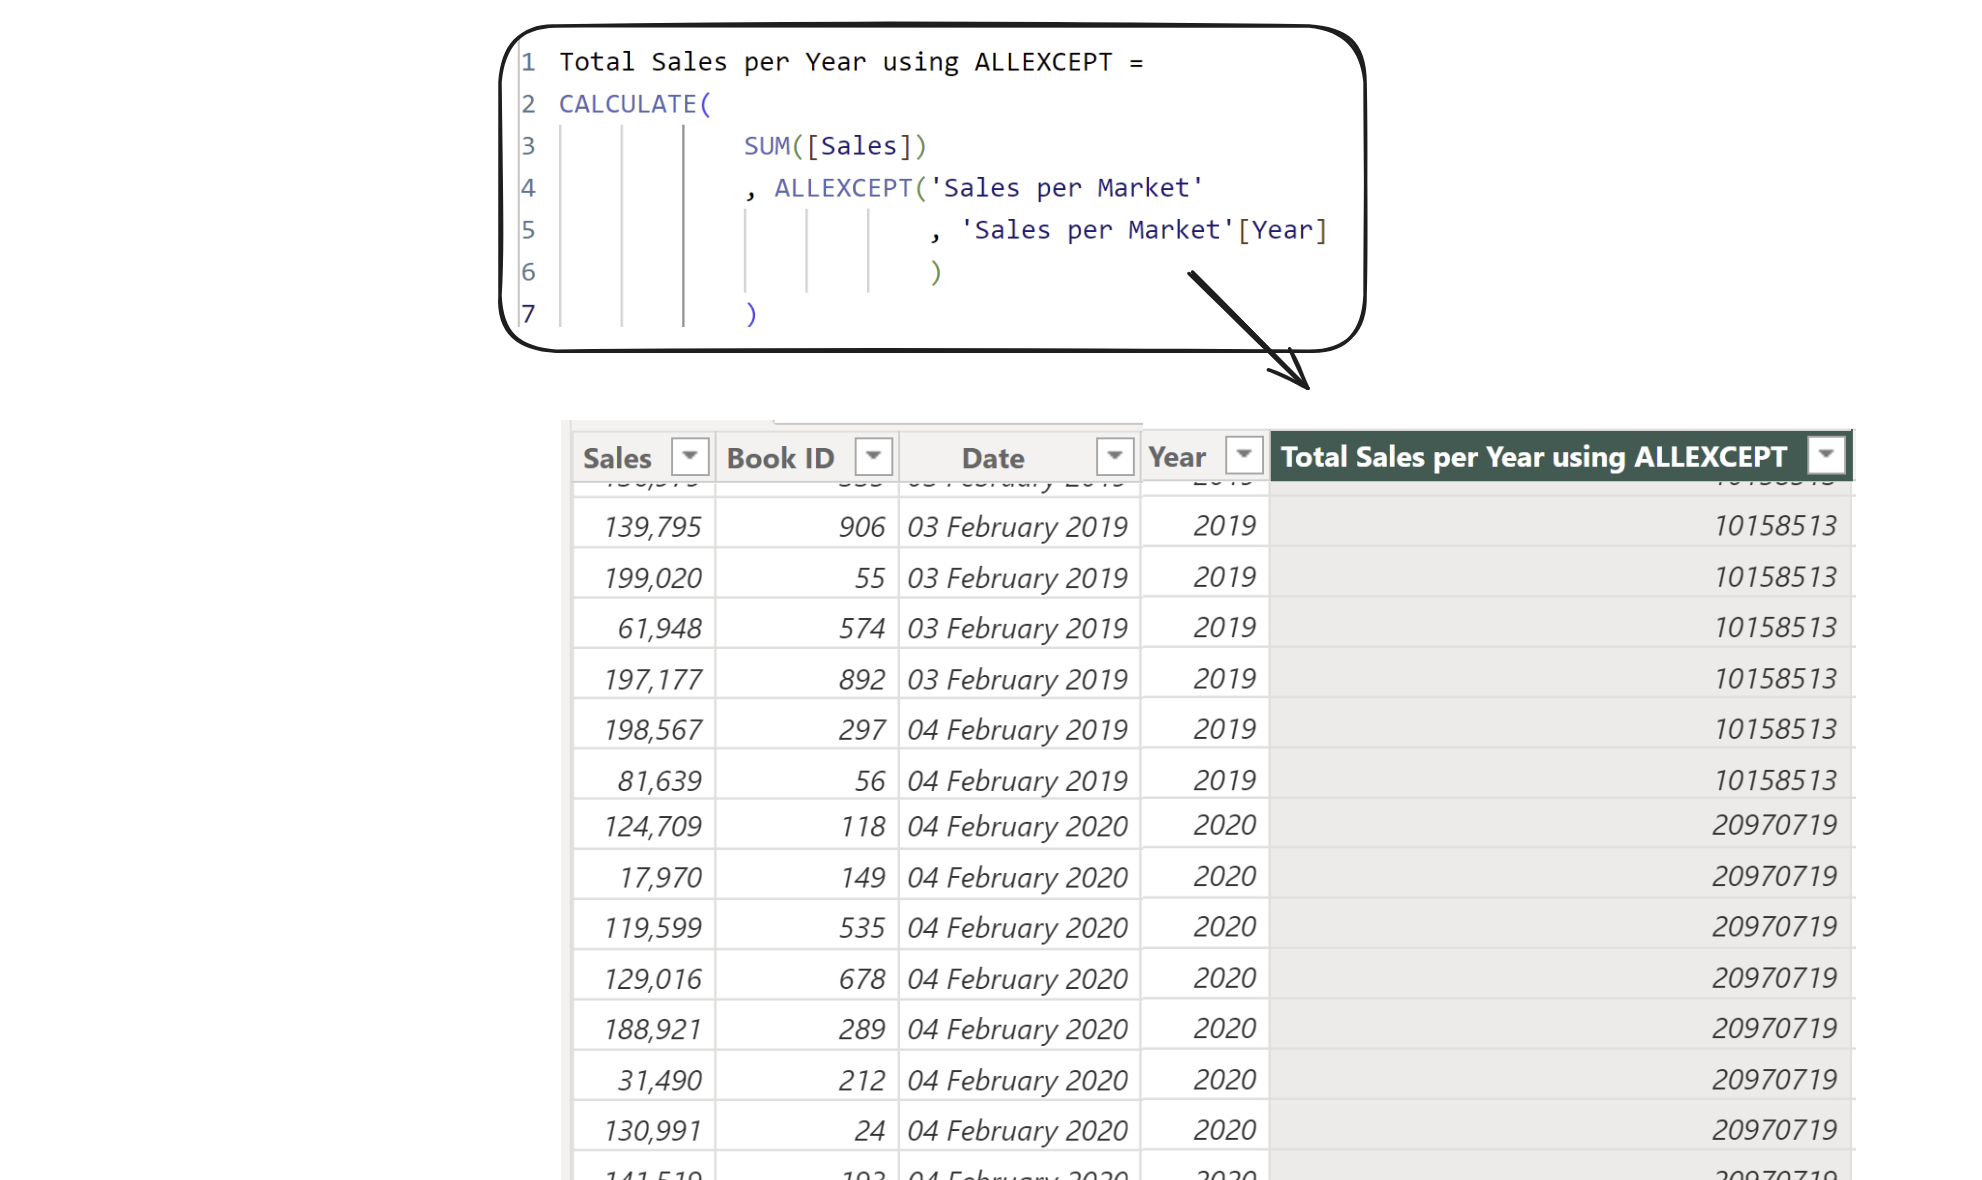
Note: you can add as many columns in ALLEXCEPT as you like, i.e. you can group by as many columns as you like.
REMOVEFILTERS accepts columns in its argument. This makes it so that
CALCULATE([Aggregated Field], REMOVEFILTERS([Column 1], [Column 2],...))
Behaves as if you group by whatever is in the view without the columns in REMOVEFILTERS, and aggregate by the chosen aggregated field. Note that this makes the most sense as a measure, since using it in a column treats every row as being in the view.
Combining row level filters and filter functions in CALCULATE
Within the analogy of aggregation and joining, the row-level filters happen before aggregation.
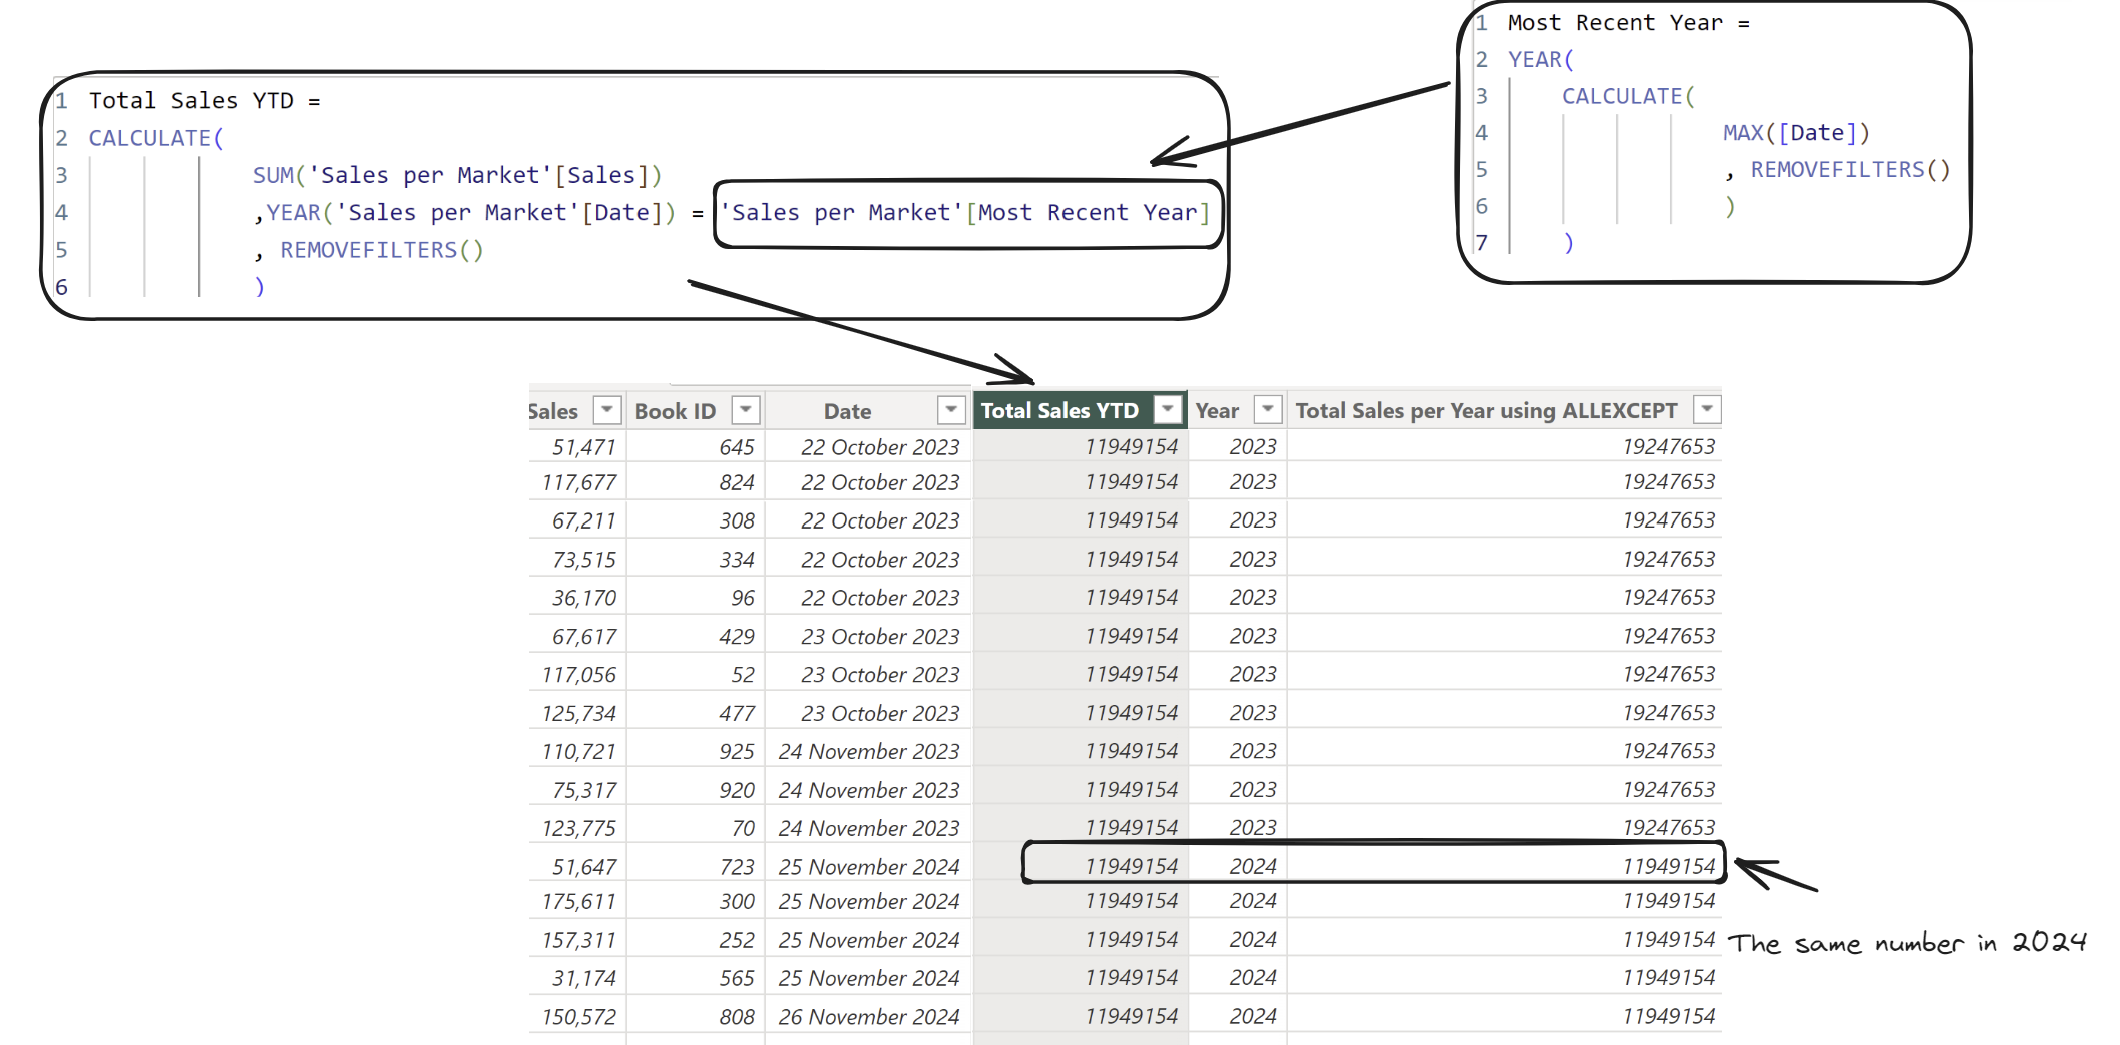
Lets say you would like to have the total sales from January until today (YTD) alongside each individual sale. You can achieve this with combining REMOVEFILTERS() and row-level filter expressions in two CALCULATE functions:
Using CALCULATE to find more specific percent of totals
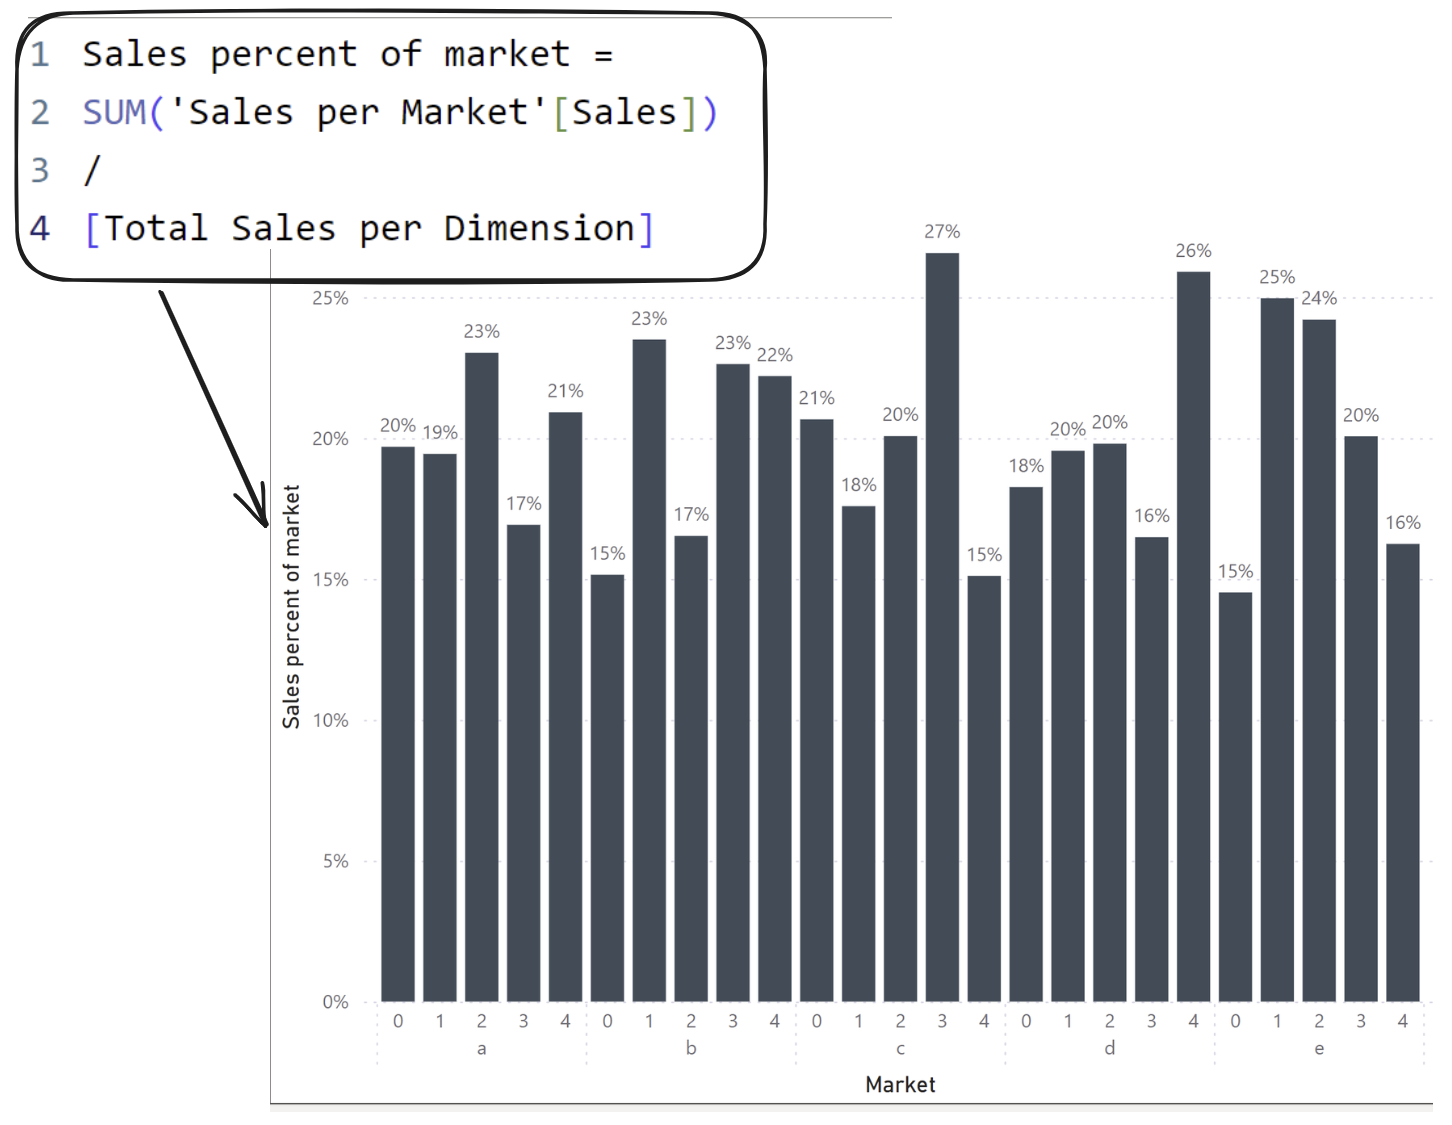
A great use of CALCULATE as a measure is to find percent of totals. In the following, 'a' has much higher sales than the other values irrespective of which market (0 to 4). To better compare the other values, you might think to compare percent sales in 'a' to percent sales in the other values.
To do this you need to first calculate the total sales, and then use this to compute the percentages.
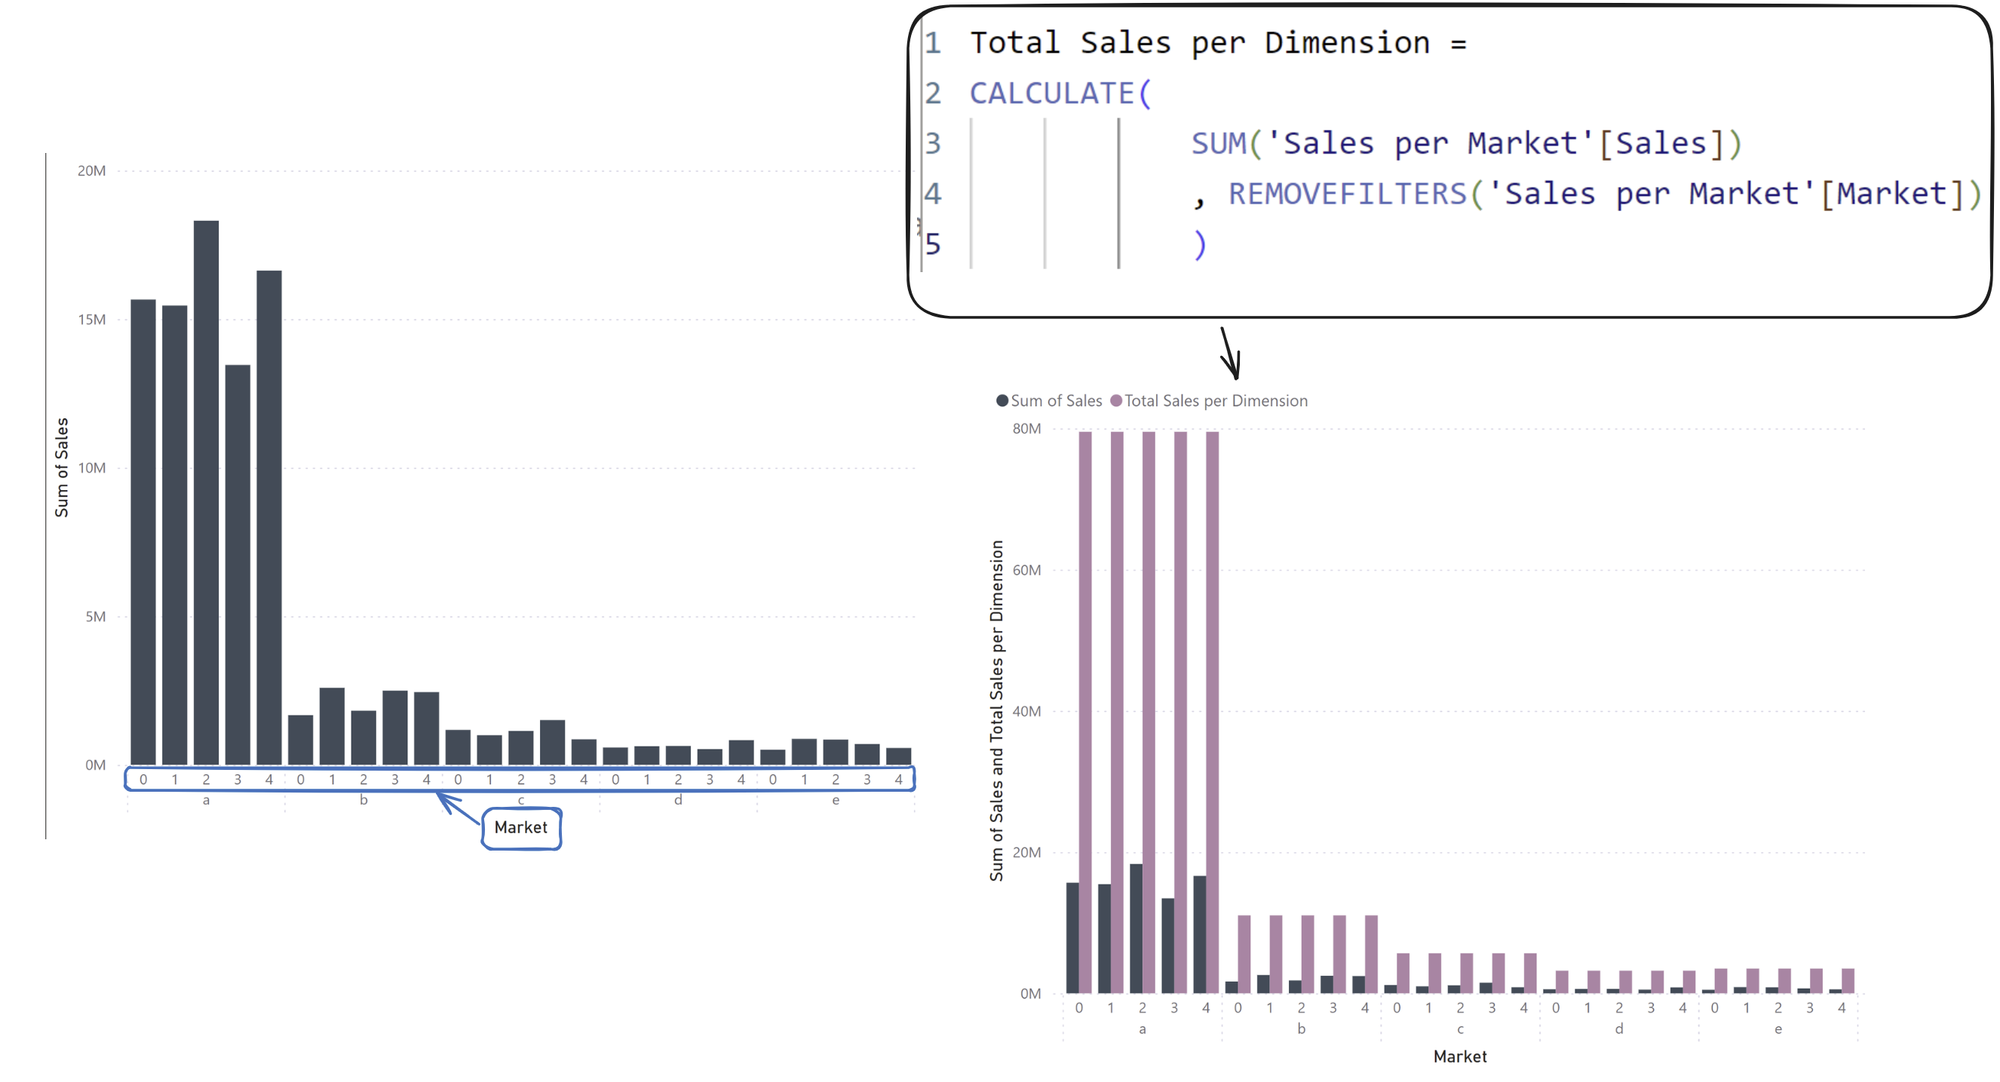
The [Market] in REMOVEFILTERS is making it so that we are grouping by the dimensions on the view except for [Market], and using SUM([Sales]) as the aggregated field. Note that this is dependent on what is added to the view!
To finish, we want to divide the grey bars by the mauve bars: