


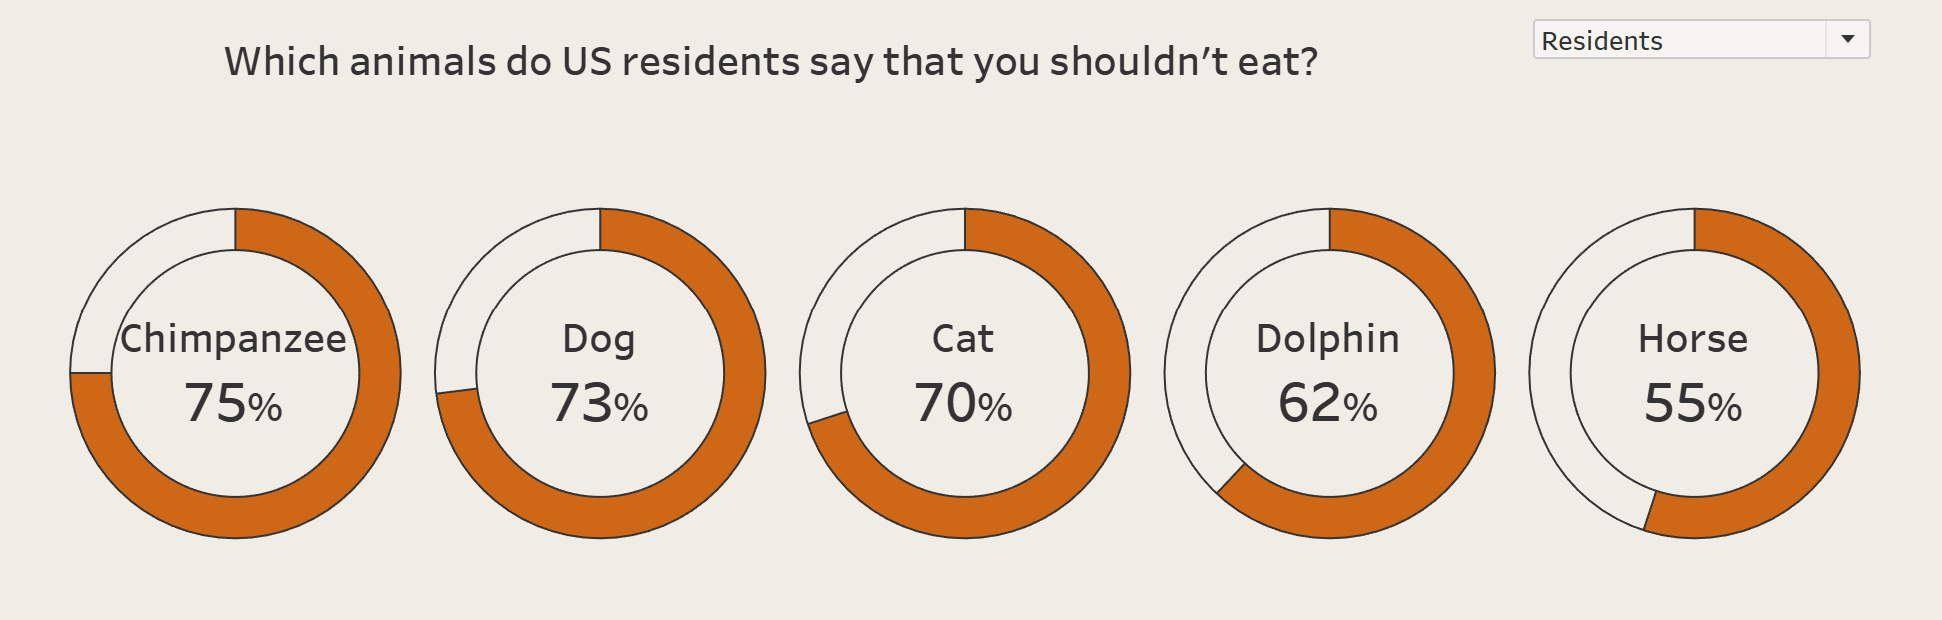
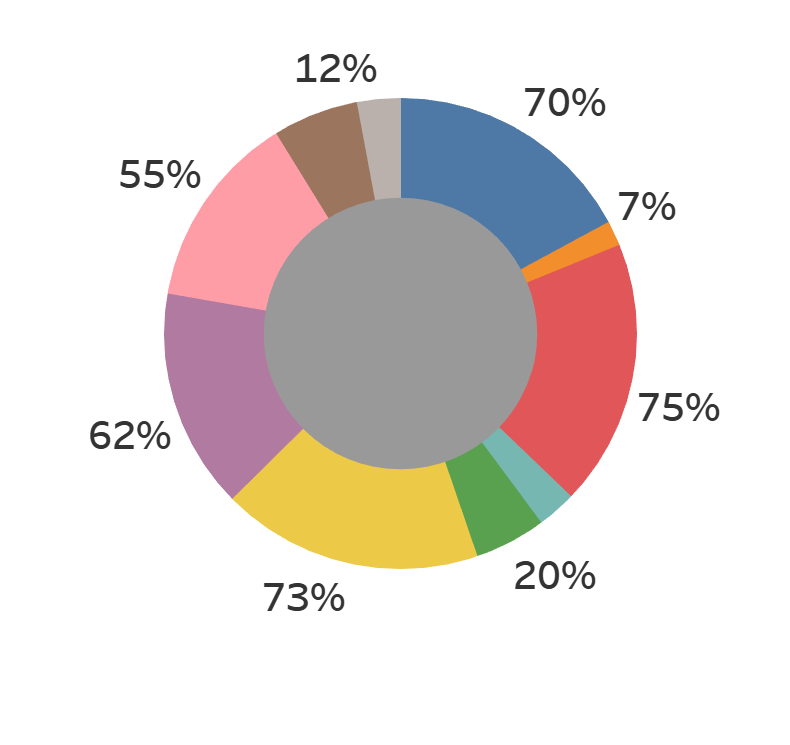
Doughnut (donut) charts can be effective ways to convey percentages, but can't be used when your percentages don't add to 100, can't be sorted easily, and can sometimes be hard to compare values for...
How to build it
- Make sure the measure you would like to use is in percentage form - a positive number between 0 and 1. Tip: set default number properties to percentage!
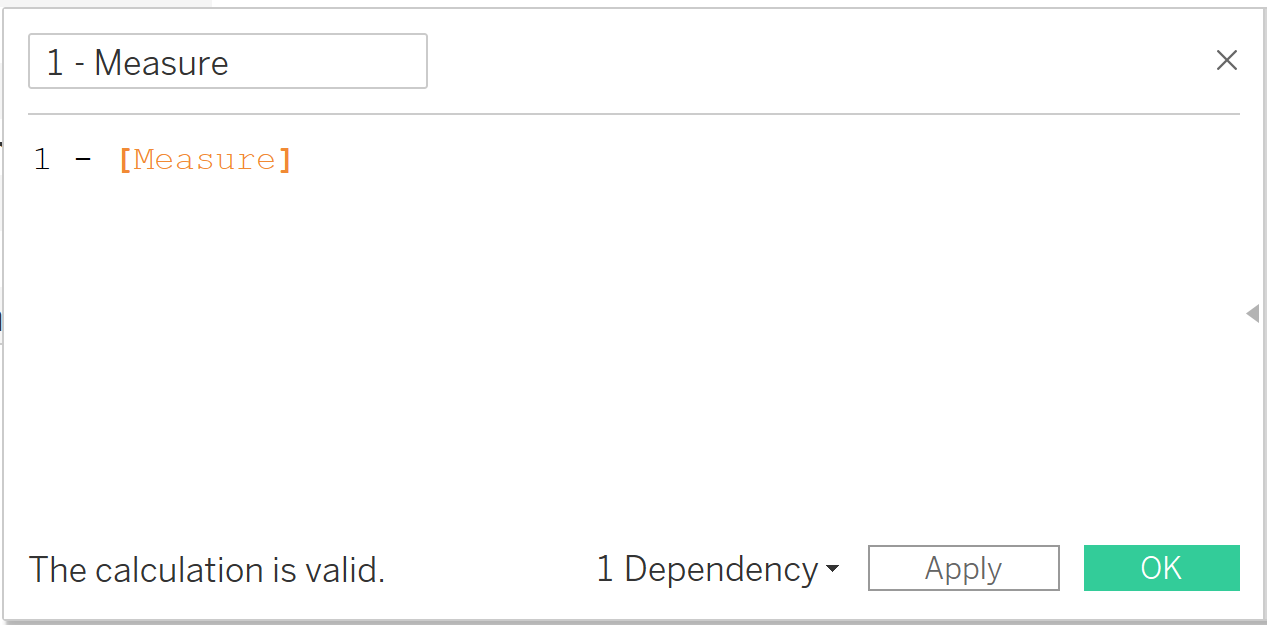
- Create a calculated field for 1 - [Measure]
- Double click the rows shelf, type sum(0) and hit enter.
- Select Pie as the marks type.
- Drag [Measure Values] from the data panel into Angle.
- Add a [Measure Names] filter and untick all measure values except for the measure you want, and the [1 - Measure] calculation you created.
- Hold ctrl (or cmd) and drag the [Measure Names] filter into Color.
- On the right side of the view, you will see the measure names colour legend - make sure the measure (not [1 - Measure]) is listed first!
- Hold ctrl (or cmd) and drag the sum(0) in the rows shelf to an empty space in the rows shelf to duplicate it.
- Right click the sum(0) row you just made and click dual axis.
- Click the marks shelf titled AGG(sum(0)) (2) and remove the colouring and angle - make sure this marks shelf is below the one named AGG(sum(0)) to layer correctly.
- Resize this pie chart to create the doughnut hole.
- Drag the measure into Text for AGG(sum(0)) (2), and also any other information you would like to display inside the doughnut.
- (optional) Drag a dimension into the Columns pane and sort it by the measure you have been using.
- Format! Colour everything how you would like, remove all axes and lines, and do any formatting you would like. Optional: In the Color settings, set Border to black for both AGG(sum(0)) (2) and AGG(sum(0)) .
Example viz:
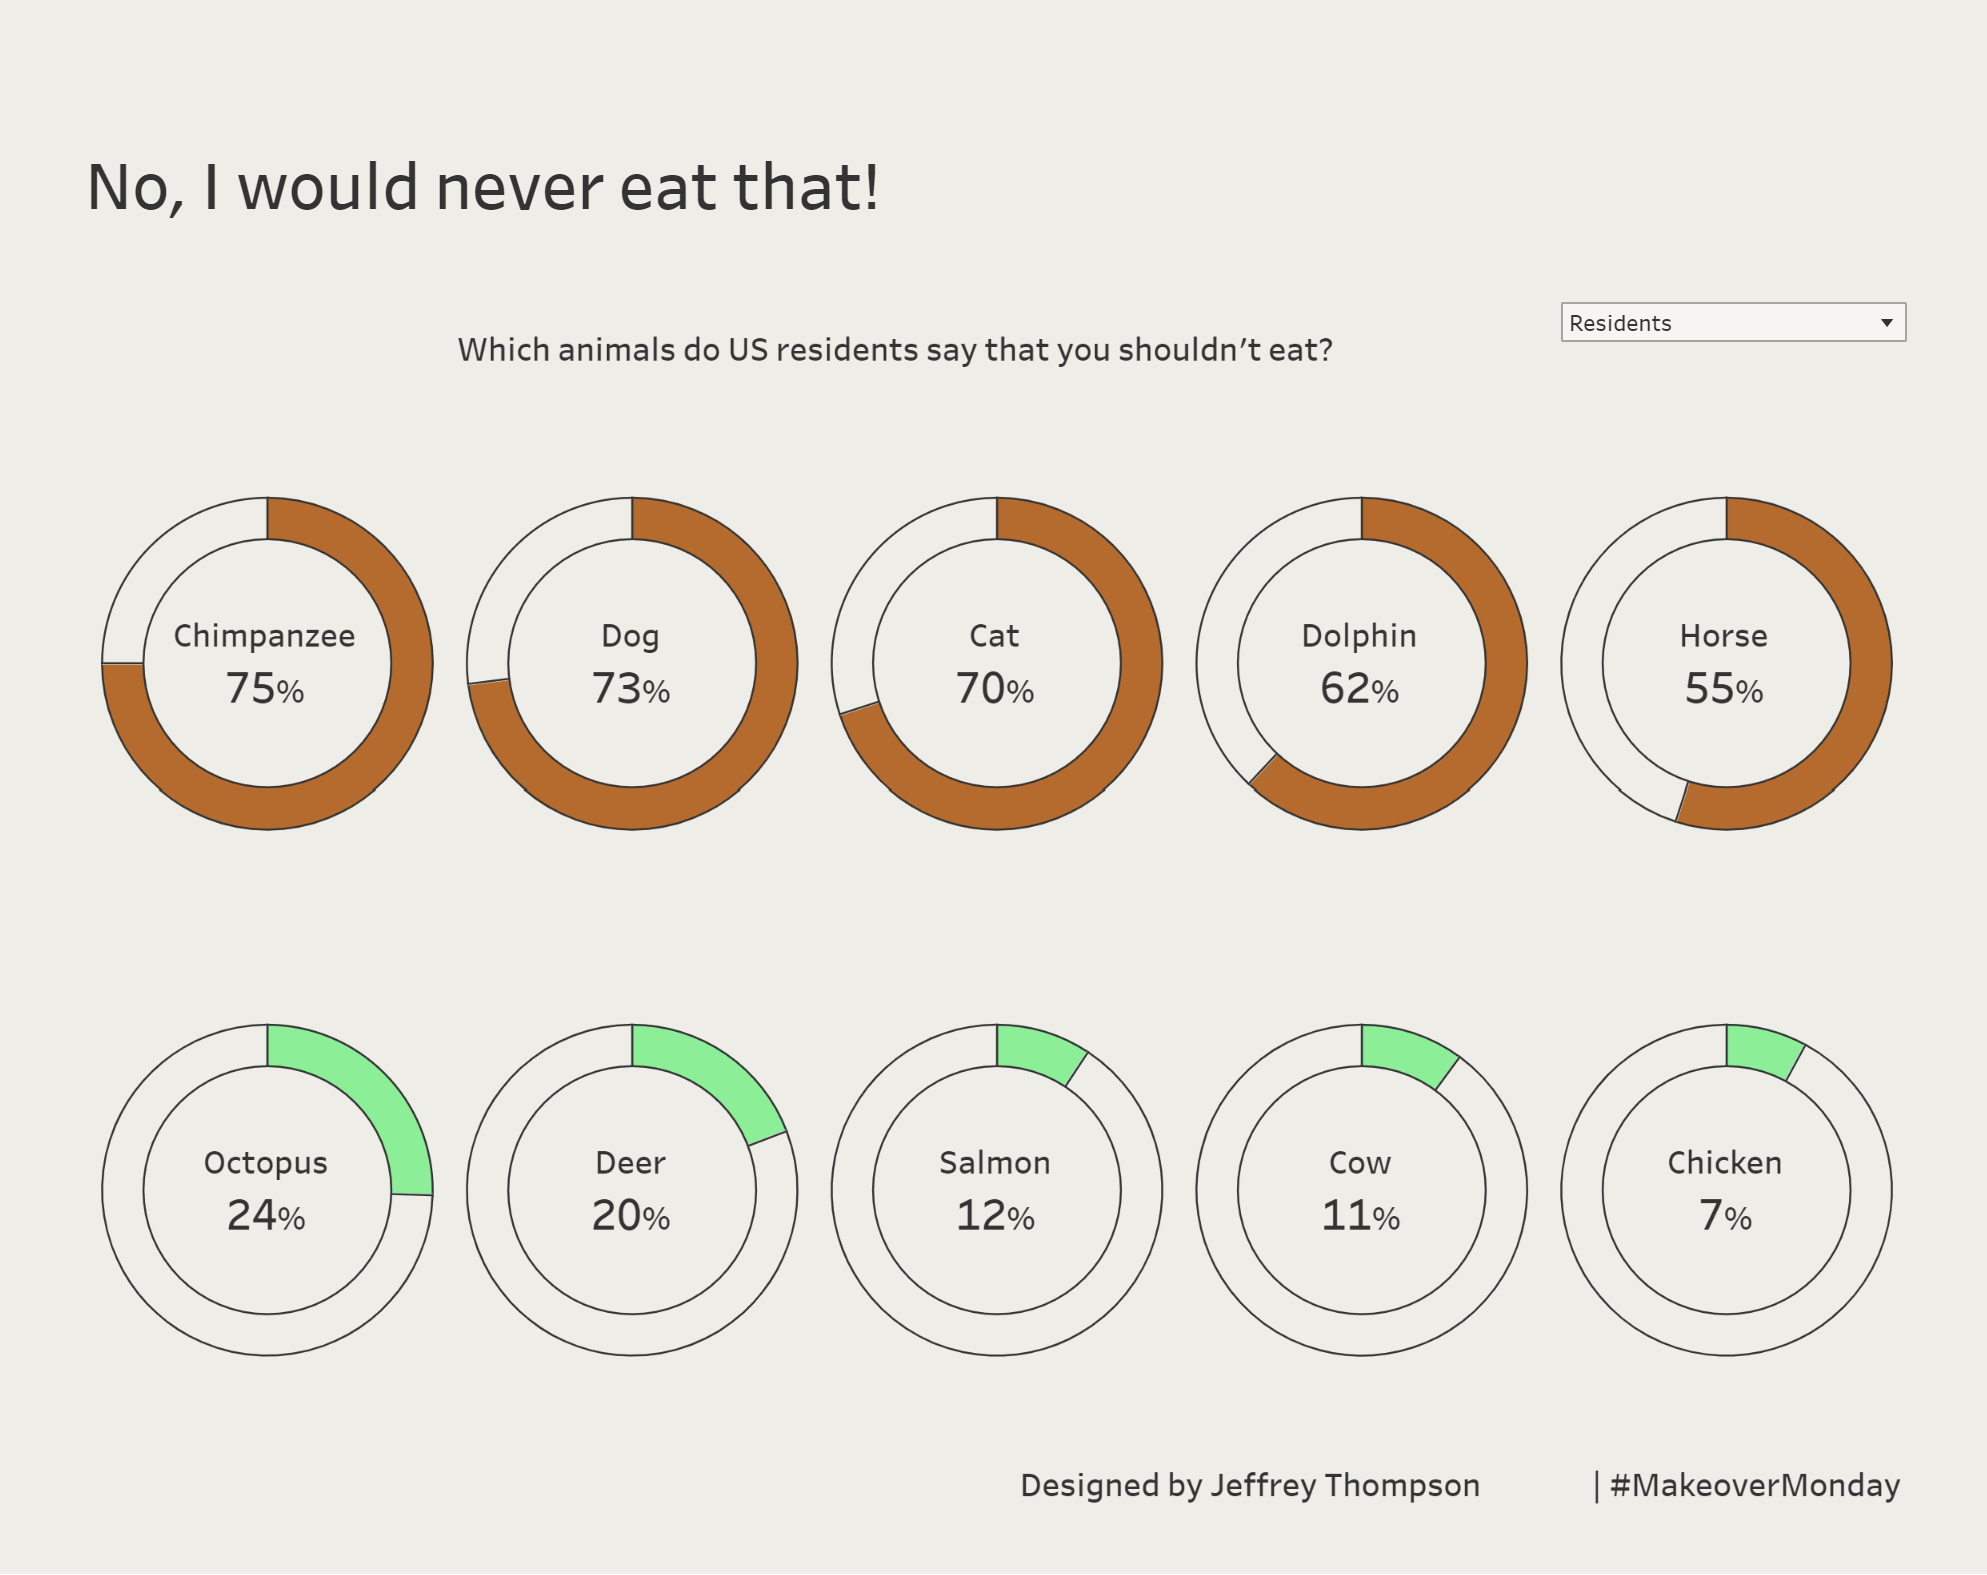
Link to example viz here.