


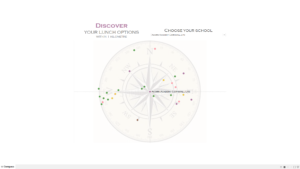
Recently I made a viz of lunch options for schools. It’s in the form of a compass: the school you select appears in the centre of the compass, and different lunch-making businesses appear at the correct distance and direction from the school.
The link is here, and here’s a screenshot:
There are a few steps involved in doing this.
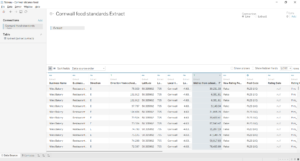
- Make sure that your data has a row for each school / restaurant combination. It’s up to you as to how to do this: I may publish a future post on using Alteryx to calculate the distance and direction between two points. In particular, the data must have a field that gives the distance from each starting point to each finishing point, and another field for the direction in degrees.
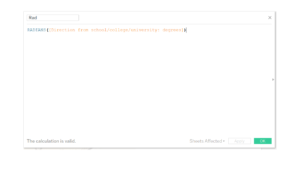
- Next, you’ll need to turn your distance and direction into northings and eastings (i.e. co-ordinates for how far north the destination is, and how far east it is relative to the starting point). Firstly, convert your degrees to radians with the RADIANS function, as below.
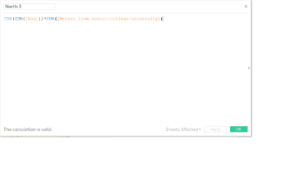
- Here you’ll need a bit of trigonometry to calculate the eastings. It’s basically a series of right-angled triangles, where you have the hypotenuse and the angles. To calculate eastings, you’ll need the sine function (SIN in Tableau), and to calculate northings you’ll need cosine, as below.
- Create a parameter to select your school.
- Drag your northings and eastings to rows and columns, then drag the locations to rows.
- Find an image for the compass. I found a free stock image. You can add it to your dashboard by going to Map > Background Images, and set your eastings and northings as the fields for the image, adjusting the X and Y dimensions to match the extent of your data.
You should now have a compass. If it doesn’t work, check all the steps carefully, particularly the trigonometric calculation.