Learning through Makeover Monday #1
With thanks to our very own Chris Meardon
In this example, I’ve labelled the ends of my bars with total values using a Level of Detail calculation and a hidden Dual Axis chart. I talk that through in Part 2, which is coming soon.
So there I was: a cup of tea in one hand, a mouse in the other, sat in front of the latest Makeover Monday with some apprehension. ‘Global Wealth by Country’, sitting pretty with just 3 fields, seemed deceptively simple. Nonetheless, I had a hypothesis: the top 5 countries in each of the specified regions account for a significant proportion of that region’s wealth.

It’s worth prefacing this post with the fact that my example is bad. To kick things off, the dataset provided for Week 7 seemed inconsistent in its grouping of countries by region (‘India’ and ‘China’ had their own regional category, for example, which were ultimately integrated into ‘Asia-Pacific’ for ease of use). Going forward, I’d probably scrap regional considerations altogether, and focus on comparisons on the country level.
Secondly, my choice of chart and formatting obscures the nature and number of countries within each region. This is important: I’ve chosen to emphasise ‘part-to-whole’ relationships by rank, which generally requires consistency in the number of records to be effective. It’s no good seeking a Top 5 for a region like North America, with a mere 3 constituents, and then comparing the results to the ‘Asia-Pacific’, with its whopping 65 individual marks.
Having addressed these concerns, let’s forget about them, and just take this as a practical exercise. And for that, here are some steps:
STEP 1: Create the base chart
In this case, I dropped SUM(Wealth) onto columns, and Region and Country onto rows ― in that order. Easy peasy.
STEP 2: Sort
Work out how you want to arrange the marks, and sort accordingly. Here, I’m focused on the wealthiest countries per region, and therefore want their values placed on the left for immediacy. Similarly, I’d like the wealthiest regions at the top. This was achieved by sorting Region by SUM(Wealth) descending, and Country by SUM(Wealth) ascending.

STEP 3: Create, place, and configure an INDEX() table calculation
Create an INDEX() table calculation by typing the function into a new calculated field. It’s surprisingly simple:

When configured correctly, and present in the view ― here, on the Details shelf ― this table calculation will bring back the position of each row of the field in question. As the previous step did the sorting, I’m halfway there for setting up the functionality I want, as the wealthiest countries descend from position 1: now, I need to ensure the index calc resets its count at each region.
When placed on the Details shelf, we can see that our INDEX() field already has its own tiny triangle; it’s recognised as a default table calculation. All I need to do is edit it:

The language in the table calculation window seems to have been designed by robots, for robots. If unsure, it can be helpful to see how the labelled numbers change with each selection. Here, the largest marks in each Region have a friendly little ‘[1]’ for first place ― yay!
STEP 4: Create a calculated field to specify INDEX() ranks of interest
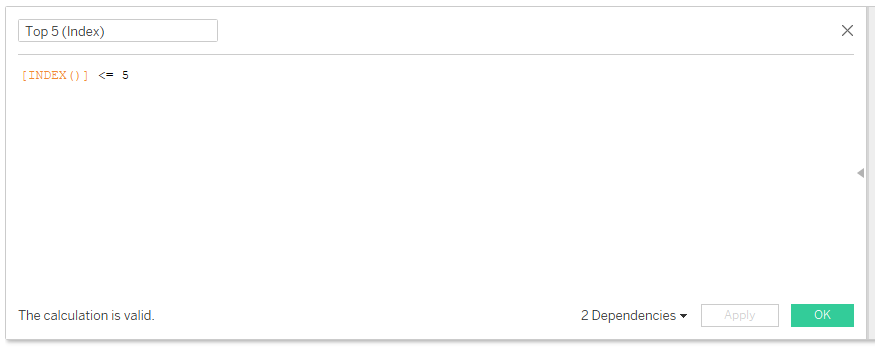
The viz is now beginning to take shape. In this step, I get the final bit of functionality working: the ranks divided by colour. I create a Boolean calculation here, as I effectively want all countries to be sorted into one of two categories: ‘Top 5’ or ‘Not Top 5’:

…and drag it to the Colours shelf!

With any luck, you’ll start with a better use case, and finish with some tasteful formatting.
Well, there you have it! More Tableau magic. In a mere 4 steps, I have a ranked, colour-coded, stacked bar chart that remains dynamic. It’s more than I had half an hour ago.
