Today marked the last day of training for DS43 and day 4 of dashboard week. We were challenged with webscraping data off the cocktail database website https://www.thecocktaildb.com/ before using the website API, all within alteryx, then exporting the data to a visualisation software of our choice.
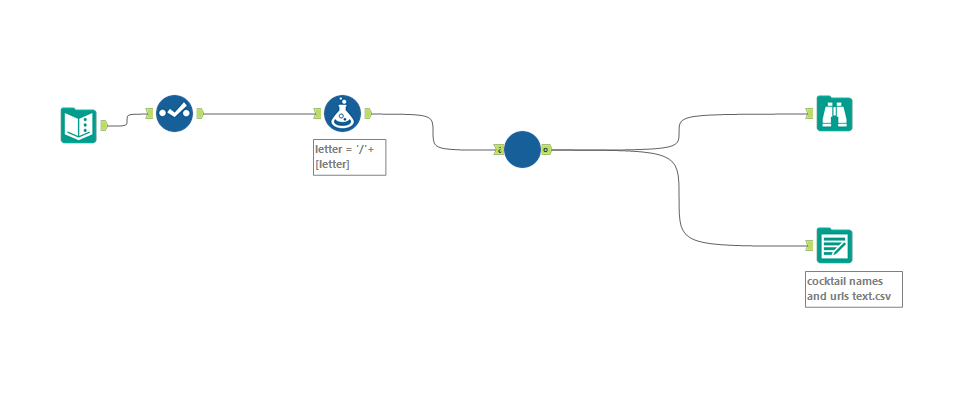
I decided to make my dashboard in Tableau. I spent all of Thursday morning trying to webscrape the data in alteryx. We needed the cocktail names, tags, ingredients and instructions. This proved pretty challenging, although we got there in the end. We all used slightly different methods as there are lots of ways to webscrape. I ended up using a batch macro. The website has lists of cocktails in alphabetical order, with each letter of the alphabet having its own page and all the cocktails that begin with that letter. My workflow for the macro looked like this:
Here, I am using the download tool and a mixture of RegEx tools to separate the cocktail names into a list where each row is an individual cocktail. I’ve used a control parameter so that I can iteratively change the letter of the alphabet in the URL to scrape each page of the website.
My next step was to insert the macro into a new workflow and run this to get a list of all 600+ cocktails. I then outputted this file to a csv. This is my second workflow:
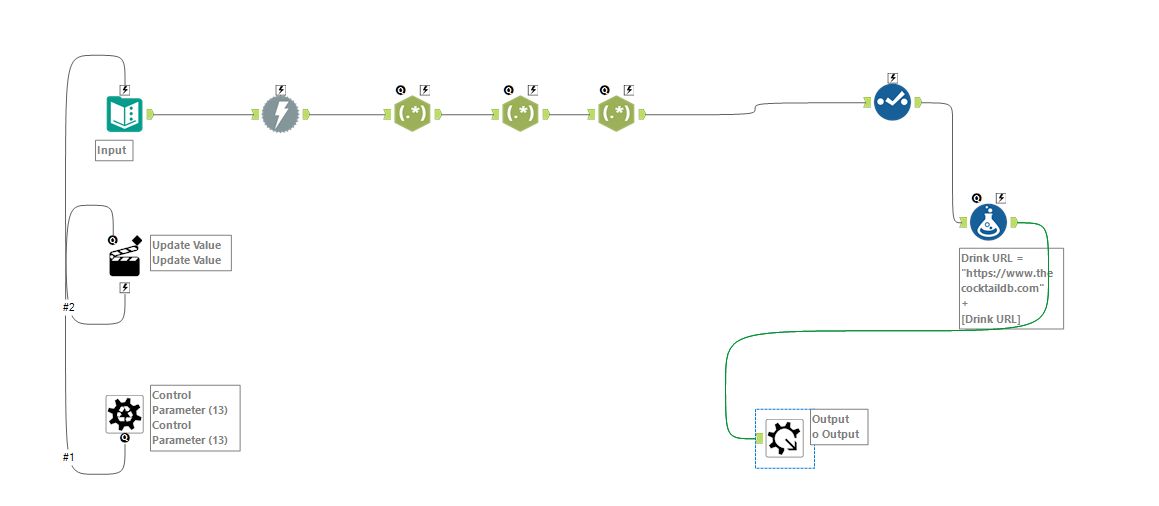
My final workflow used the output from the second to utilise the website's API. With some more RegEx tools, I used the API to get information on the ingredients in each cocktail as well as the tags and instructions. I was finally ready to start working on my dashboard after lunch.
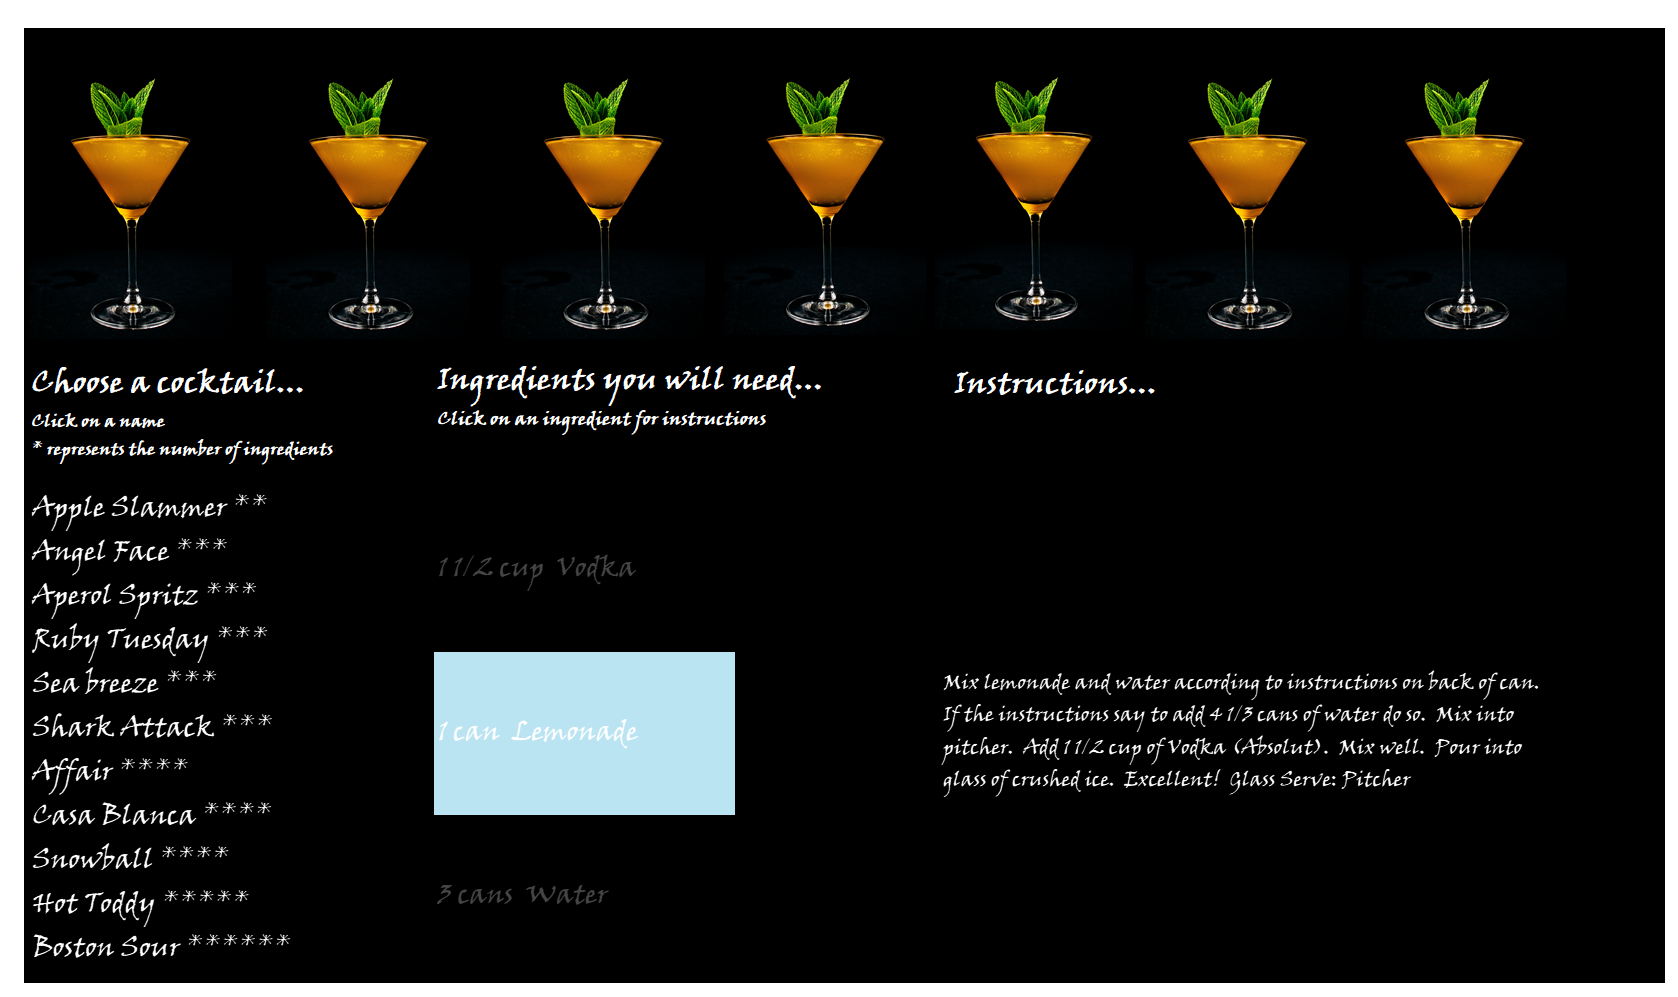
With not much time left, I didn’t sketch out a dashboard plan. I had a rough idea of what I wanted to make; a dashboard where you could click on a cocktail name to see the corresponding ingredients and instructions. I wanted to focus on the design element and make my dashboard easy to use. This was the final outcome: