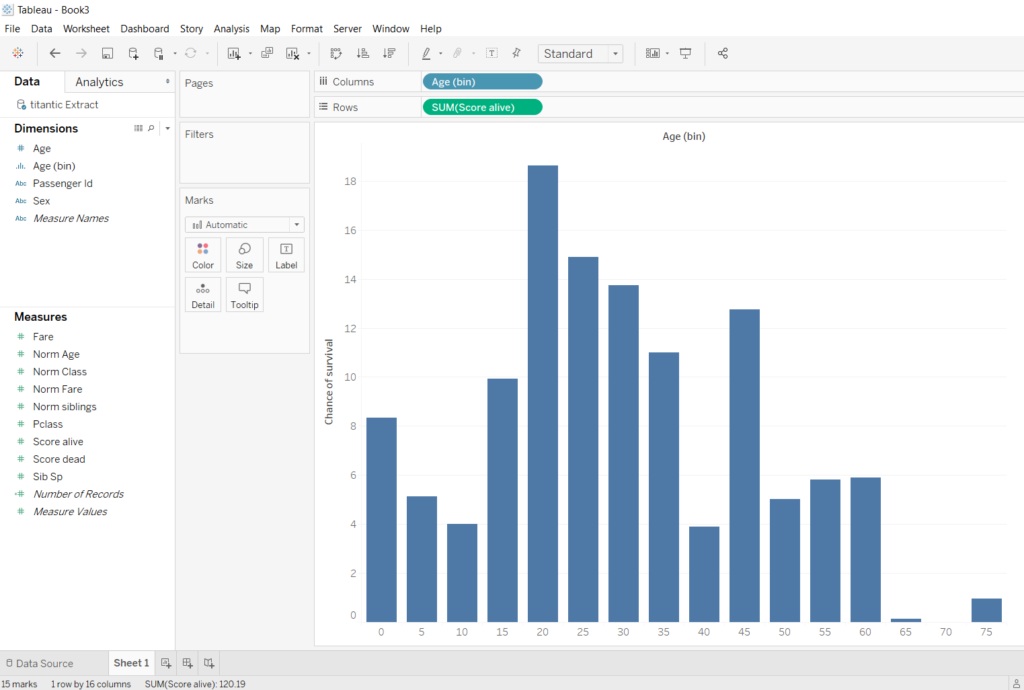
Creating a histogram is an effective way to visualise data. However Tableau has not got an inbuilt function which labels the bins properly (you can check the numerous blogs online on how to create bins for histograms). For example I created a Viz on the survival predictions of passengers aboard the Titanic based on age:

Picture 1
It’s a bit confusing at first glance. Is it only showing the chance of survival passengers aged 0, 5 or any other multiple of 5 like a bar chart? Or are the ages binned like a histogram, if so what is the size of these bins? Either way, it will take a moment to figure out. There are two ways in which we can immediately show we are looking at a histogram with a certain bin size:
- Edit the aliases to manually label the x-axis
- Create a calculated field.
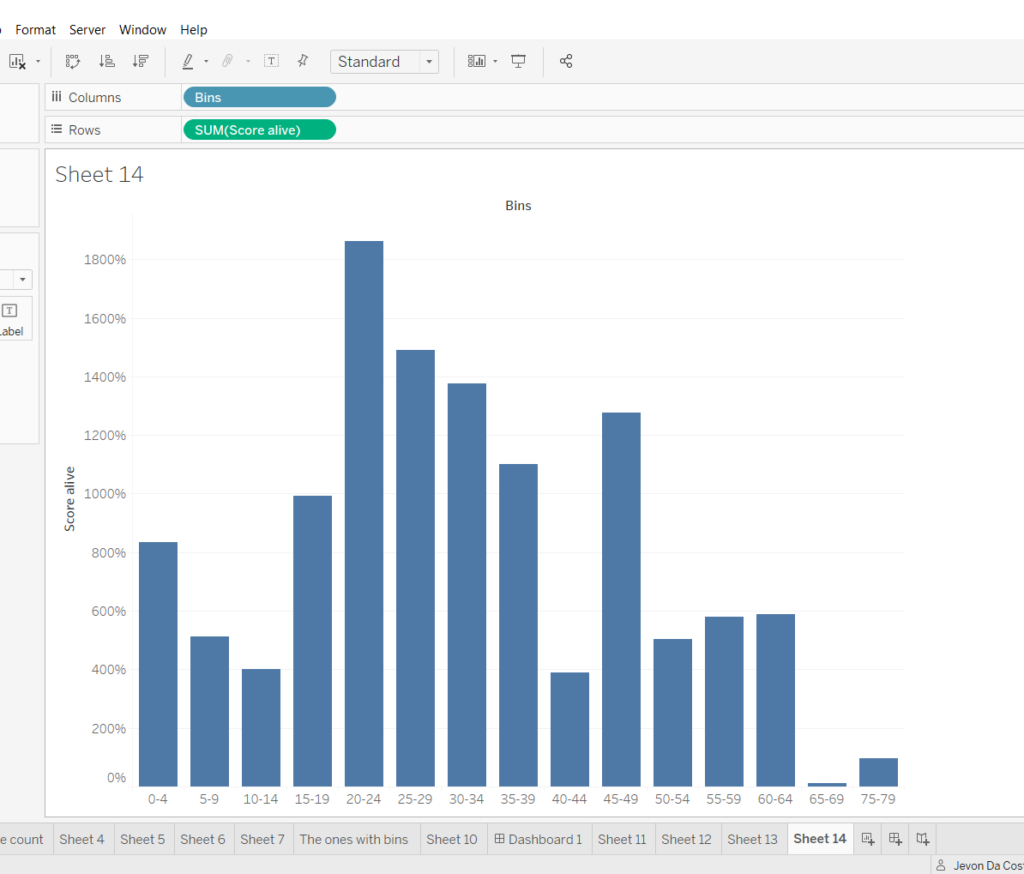
Editing the aliases is a quick way to do it, but if you have many bins it will take a long time to label all of them. Also, you would have to re-label the aliases if the bin size changed. Using a calculated field will address both problems. So this blog will show how to create a histogram like this where the ages and size of the bins can be seen:

Picture 2
Step 1
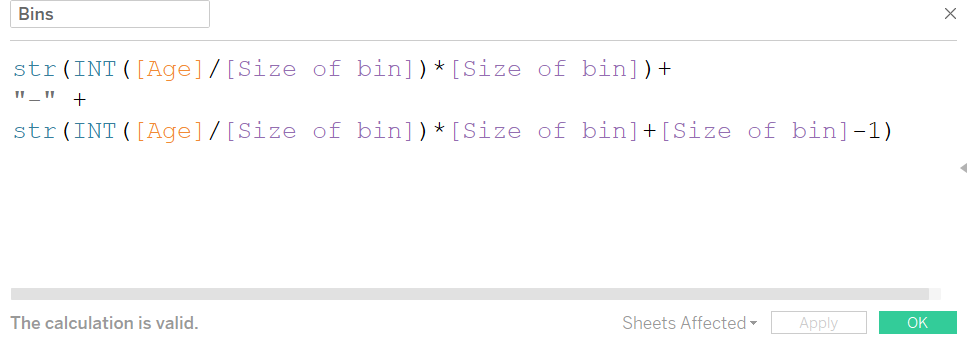
Create the calculated field:

Picture 3
There are two parts to this. The first part calculates the lower bound of the bins and the second part calculated the upper bound of the bins. The [Size of bin] is a parameter which allows the user to, well, change the size of the bin.
Step 2
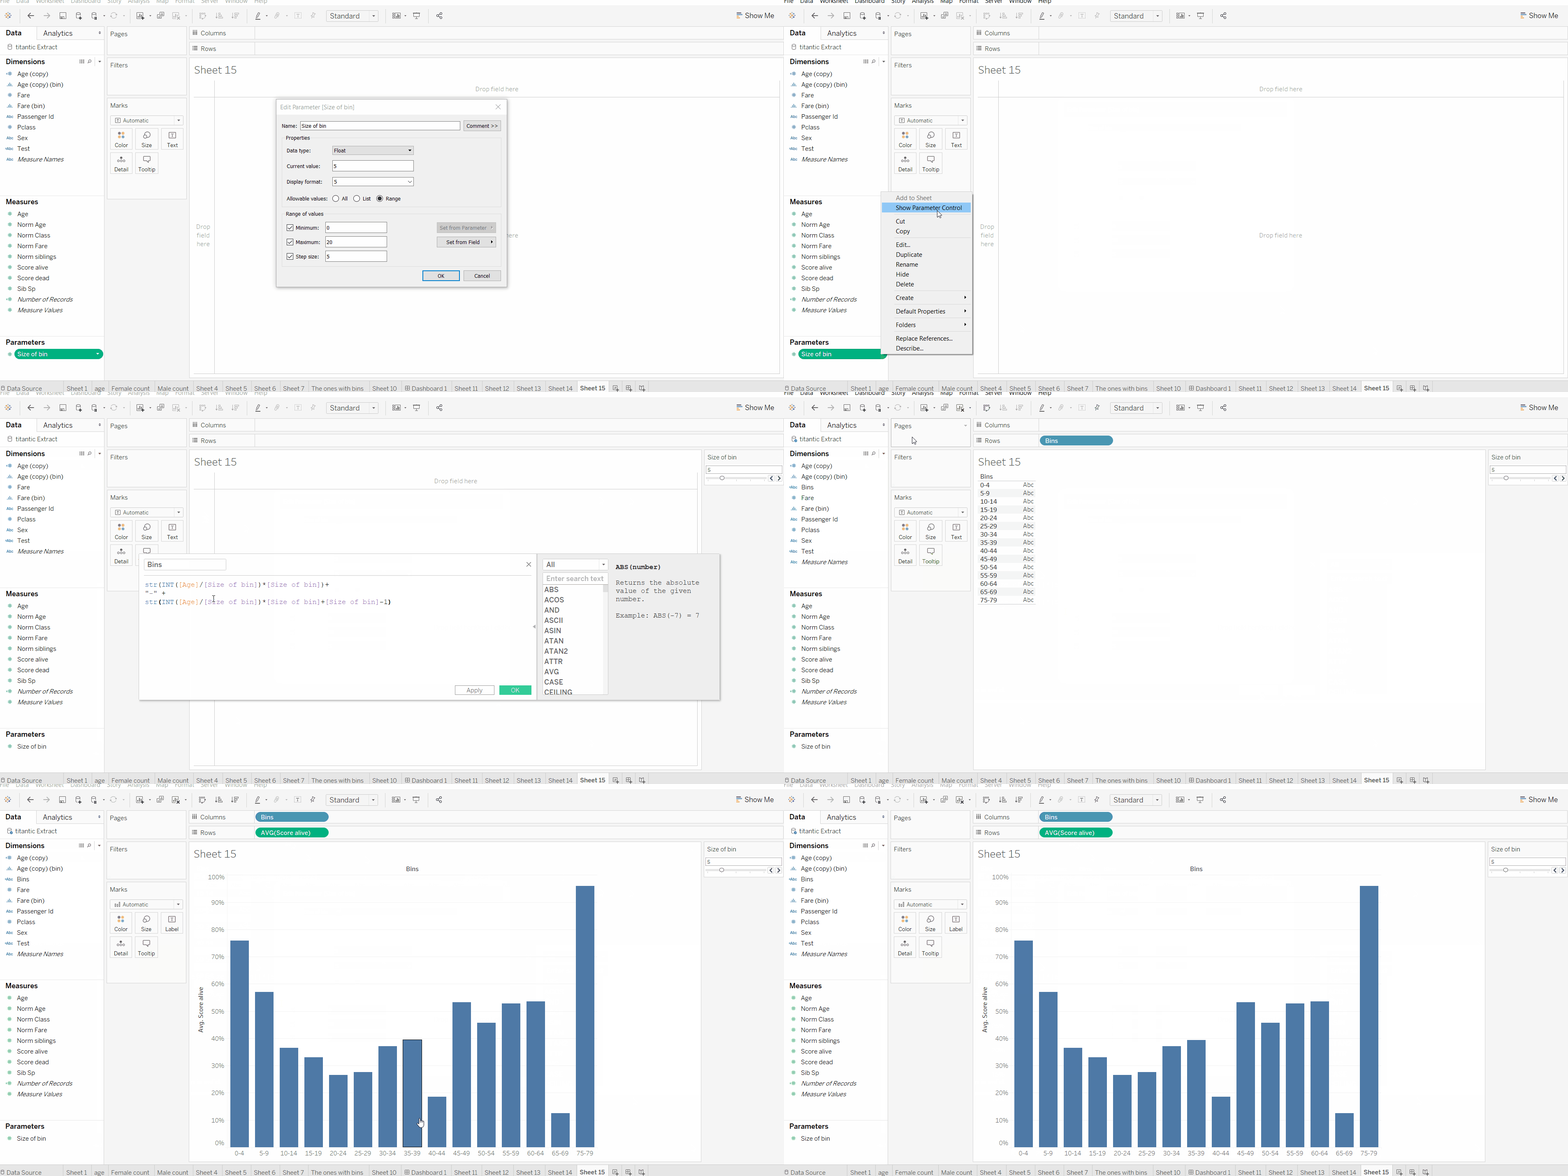
Dragging the new “Bins” field to the columns and the [Score Alive] to the rows, we should end up with the view of Picture 2, with the added feature of having a parameter to change the bin size.
And that’s all there really is to it. Take a look at the GIF below to see the steps combined:

Feel free to contact me on twitter or Linkedin if you have anything to say!
