For our first day of dashboard week, Andy gave us the difficult task of scraping the data.gov.uk website for lots and lots of files containing large expenses by NHS trusts.
See here for our brief: /andy-kriebel/nhs-trusts/
This was difficult enough in itself, but was made even more tricky due to the way my Download tool was interacting with the search results URLs meant that I, in short, led me to waste two and a half hours wondering why the Download tool’s responses were not matching those I could see on my browser.
All it needed in the end was one tick box – the unticking of encode URL text – to get the results I was looking for.
In the end I just used a Generate Rows tool to construct all the URLs for all the pages of results.
See below:
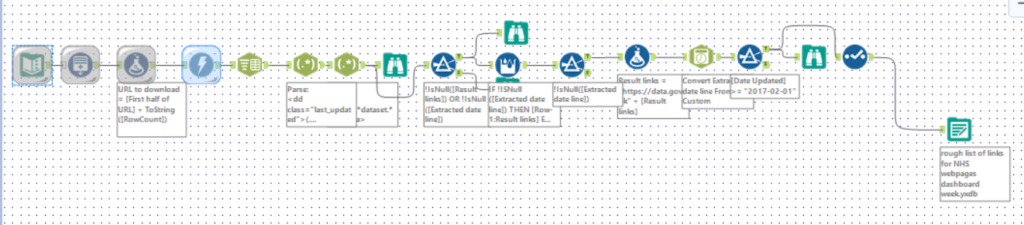
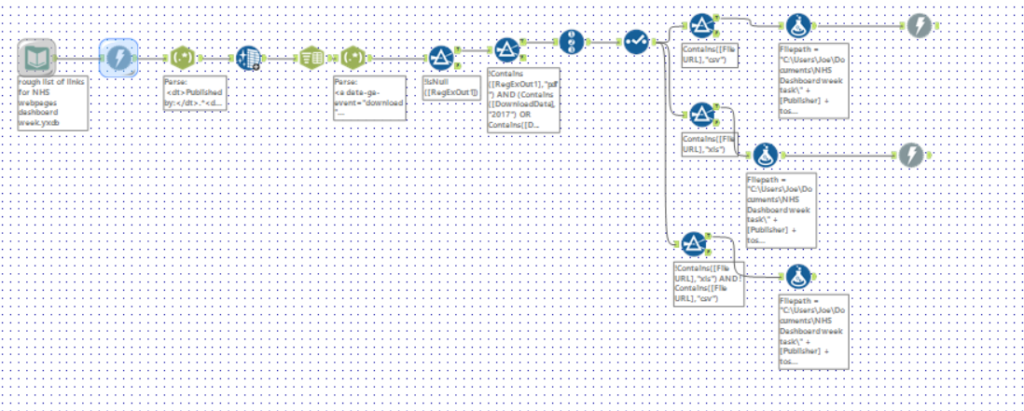
From there, I used a separate workflow to: (1) gather individual file URLs from each of the pages I pulled from the results pages (2) download them. As you can see, this involved a lot of filters to split the data into different file types and also to limit the dates to 2017 onwards – as Andy suggested.
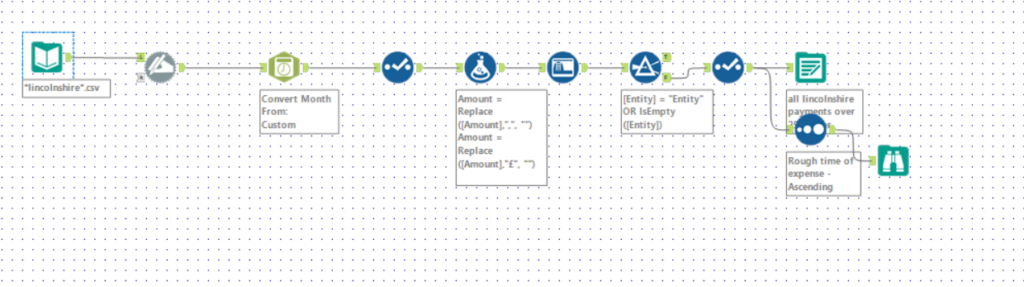
The final part of my Alteryx work was to get the expense data ready for Tableau. I originally envisioned using thousands of files from all of the trusts together. However, I ran out of time and so settled on focussing on the United Lincolnshire Hospital .csv files. I just used one filetype -I also had XLS and various other types – to make things easier for myself with an hour left to go to make a viz and also write this! See below:
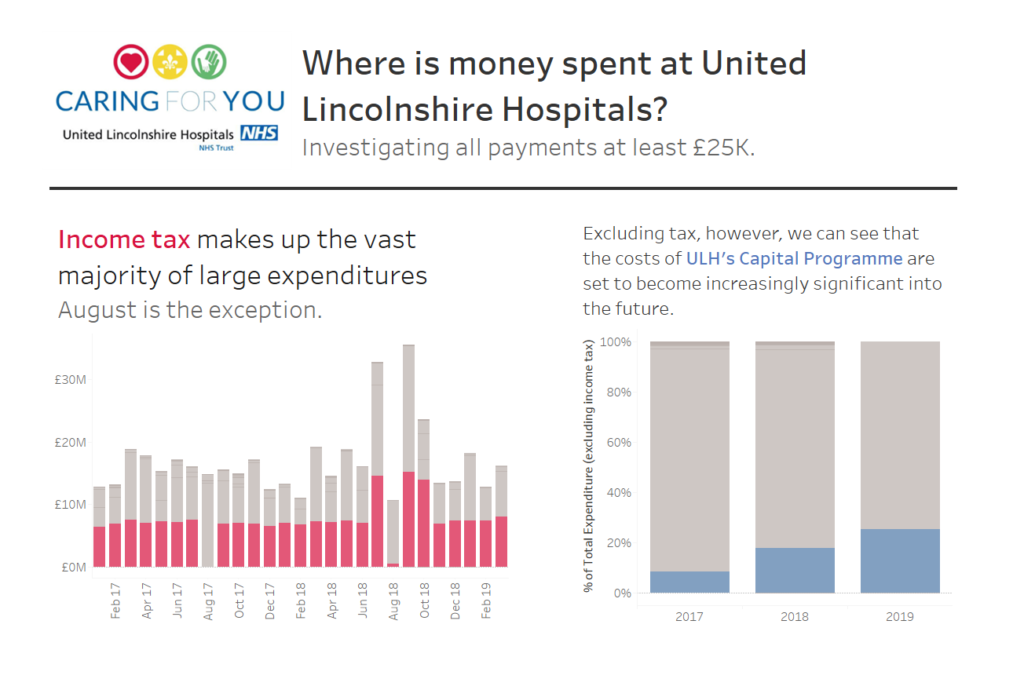
Lastly, I loaded the data into Tableau and looked for some potential stories. I found this particularly difficult as the expense types (the juicy bit in my opinion) wasn’t that well documented / I don’t know a thing about NHS trust expenses! Anyway, I made a couple of very simple graphs showcasing (i) the main cost for the hospitals (ii) a rising cost throughout the last 3 years.
Here is the final result: