


Ever wondered how to create a table showing a chosen category and the categories two ranks either side of it? Me neither, but today in our Tableau session we learned how to do just that. Jokes aside, this can actually be a very useful tool for analysis. Let's take a closer look at how to create one!
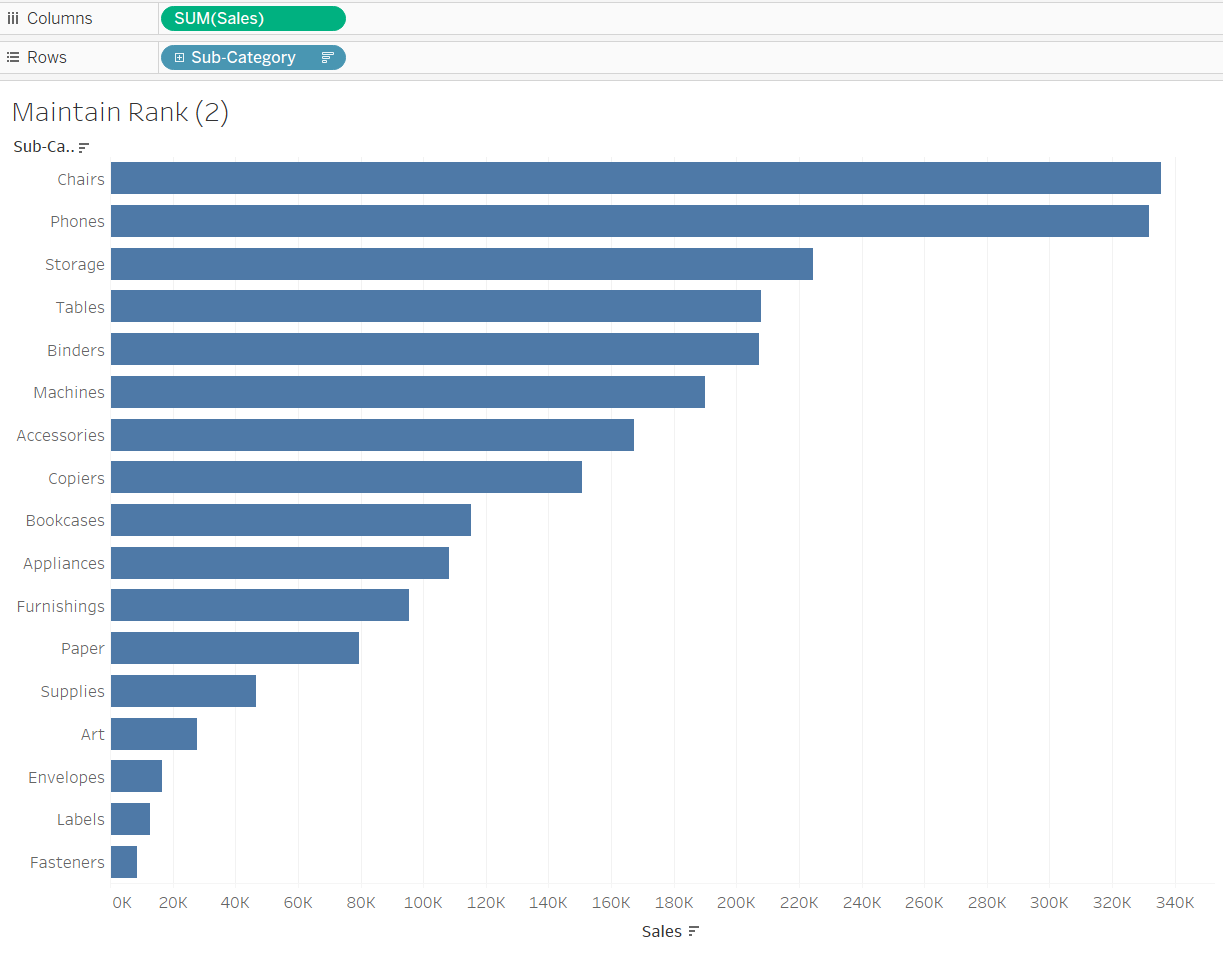
1) We can start by looking at a simple bar chart showing sum of sales by sub-category.
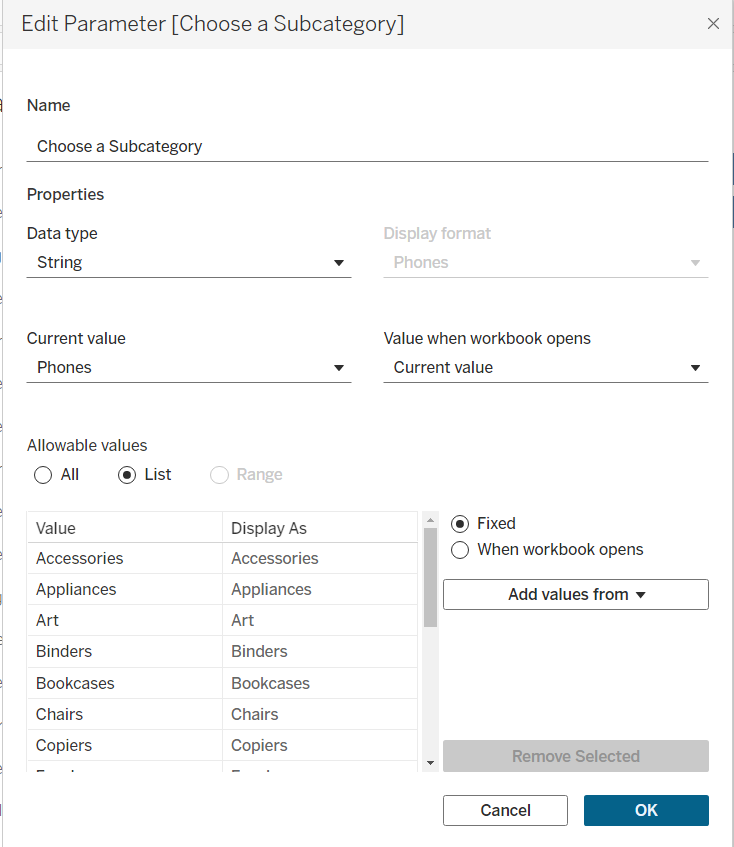
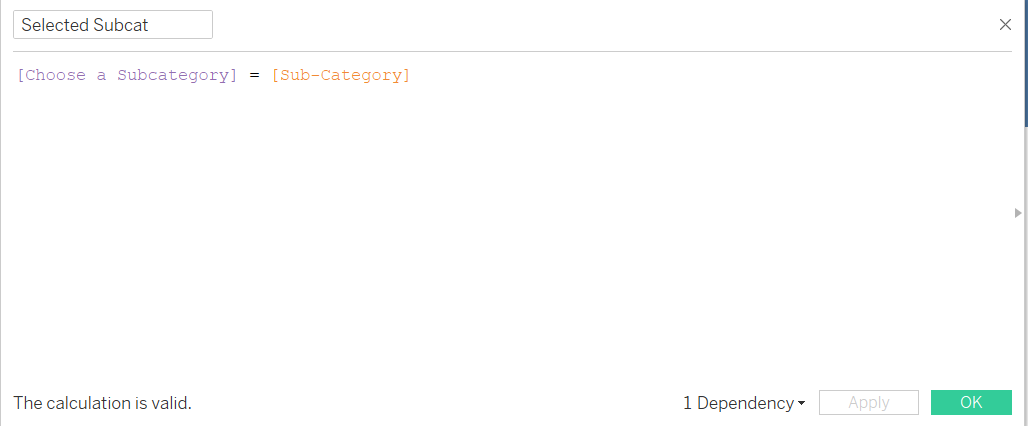
2) Create a parameter allowing the user to select a sub-category.
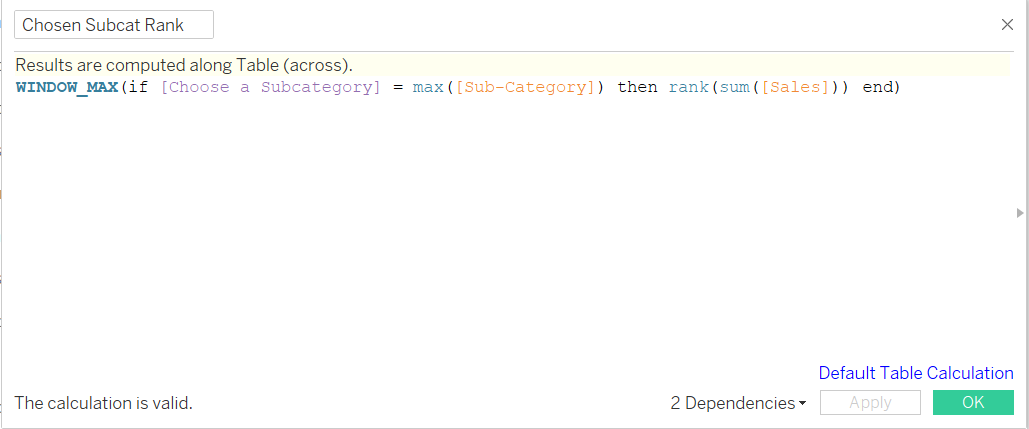
4) Now let's create a calculated field which will return the rank of the chosen subcategory.
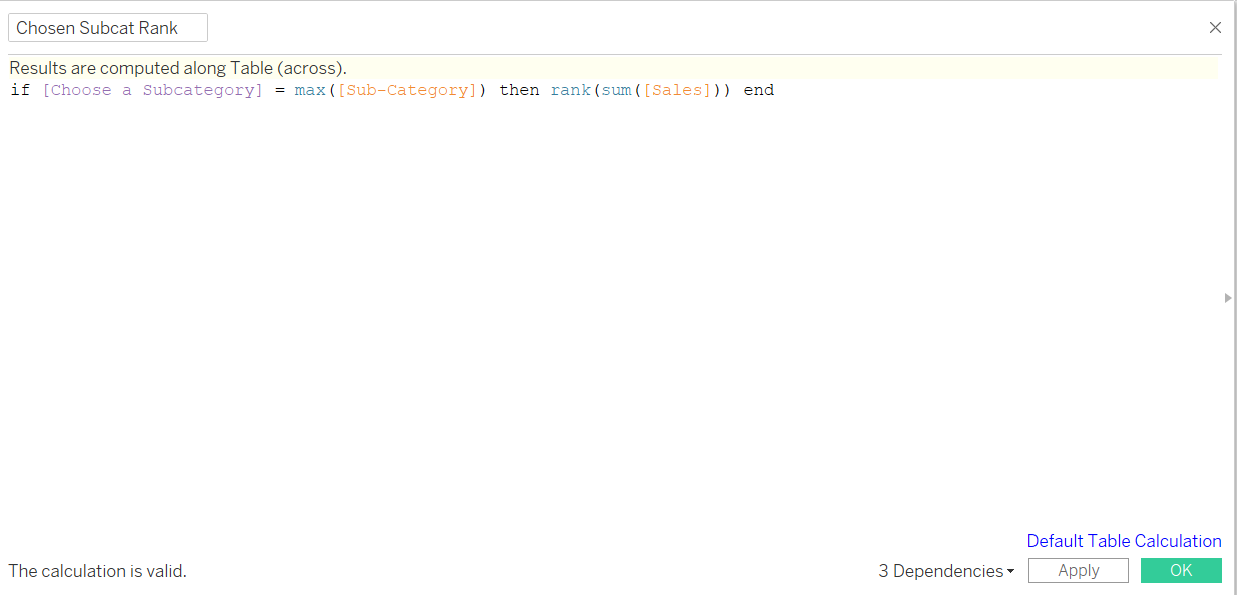
This only will return the rank of the chosen category for that specific sub-category. We want it to appear alongside every subcategory. To do this, let's wrap our previous calculation in a window_max function.
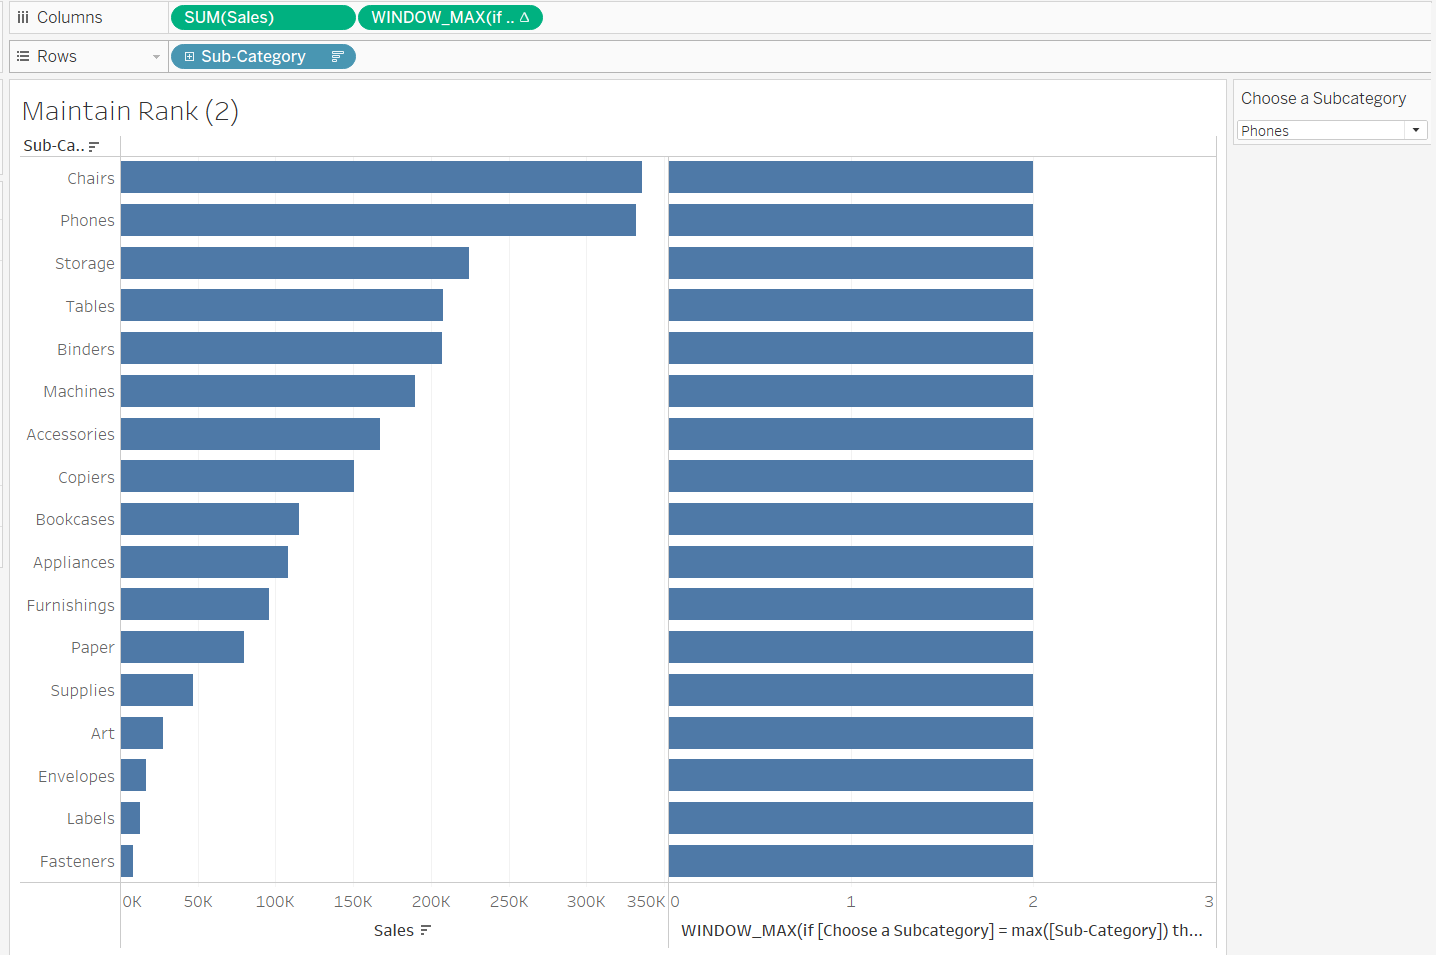
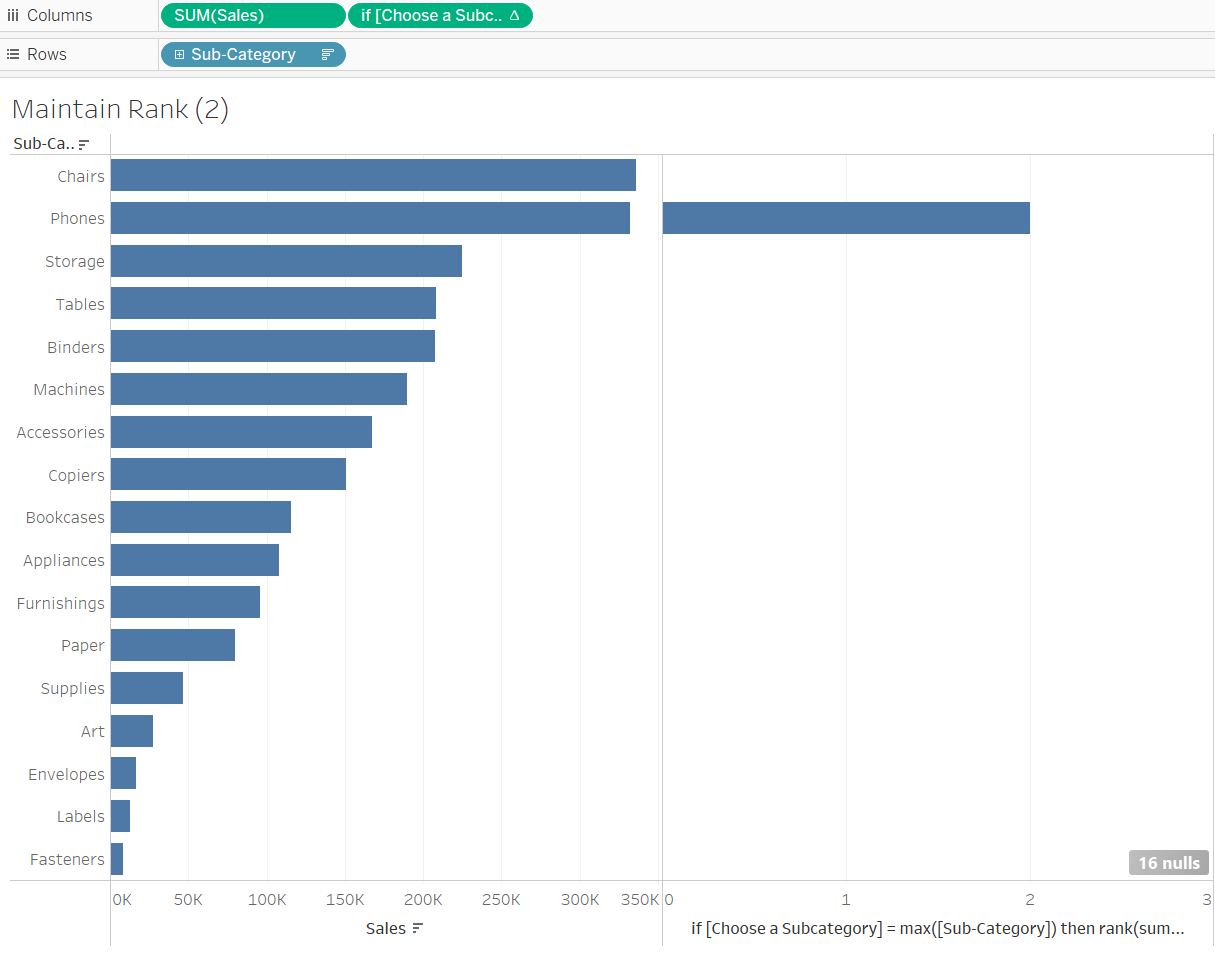
The rank of our chosen subcategory (phones) will appear alongside all of the subcategories. This will allow us to compare the rank values and, ultimately, only bring back the two above and two below our chosen sub-category.
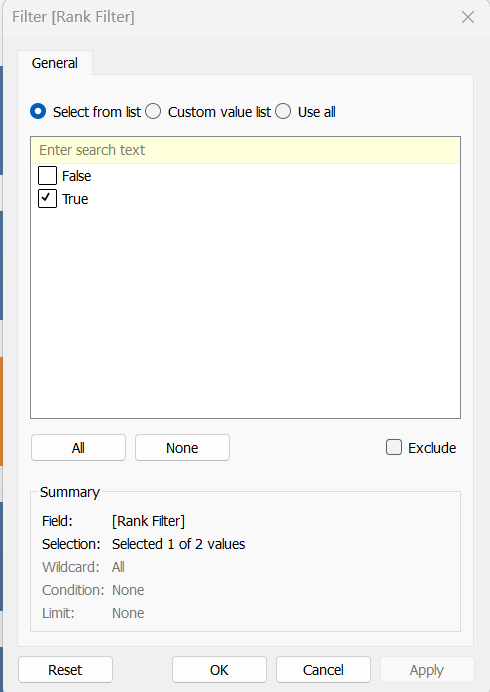
5) Now we need to make a calculated field to filter the view based on the rank of the subcategory. In this case, we want the absolute difference between the rank of our chosen subcategory and and the other to be less than or equal to two.
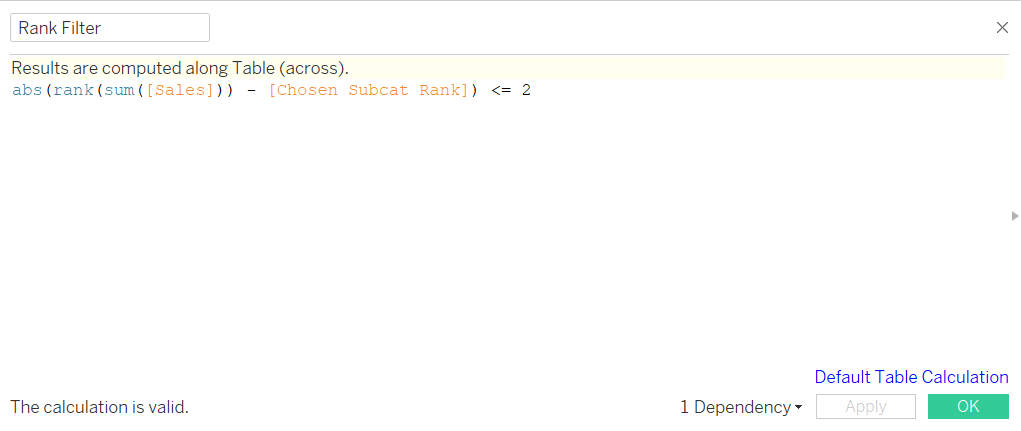
We can filter our view to only bring back sub-categories for which this field is true.
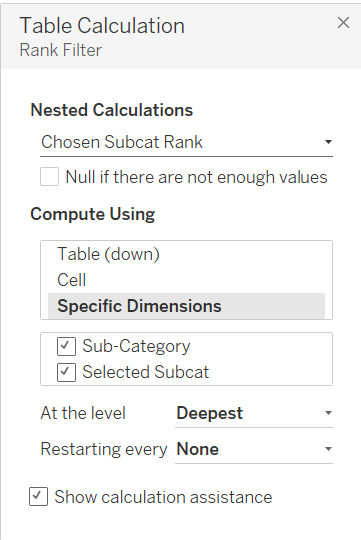
6) Finally we just need to create a calculated field to colour our chosen sub-category and alter our table calculation.
You should be left with something like the chart below!