


When creating KPIs it can be useful to include the same metric but for a previous time period to add further context.
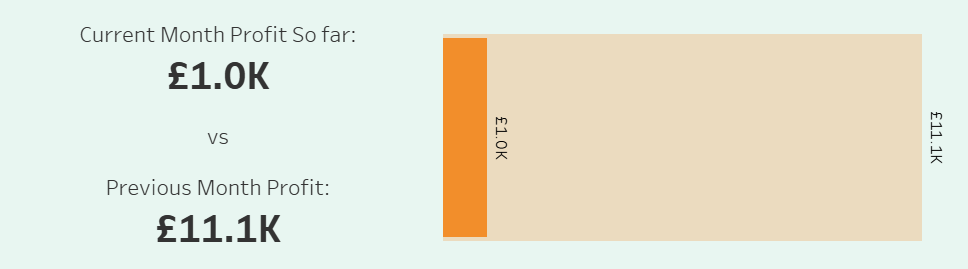
Let's consider the KPI below:

We can see that the business had about £1k profit so far this month, but so what? We don't know whether this is good or bad compared to their usual performance - this is where bringing in the profit from the prior month might come in handy.
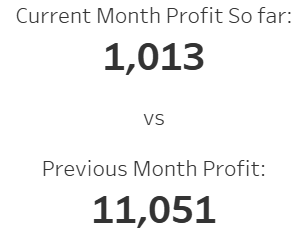
Now we have an indication as to whether they are on target to match their profit from last month and have a better understanding of the business' performance.
Now that we understand how these KPIs can be used, let's see how to create them!
The following example will use superstore data (with all future dates filtered out).
1) Let's start by creating a calculated field which will return the profit for this month up to today (i.e. the order date lies in between the 1st of the month and today).

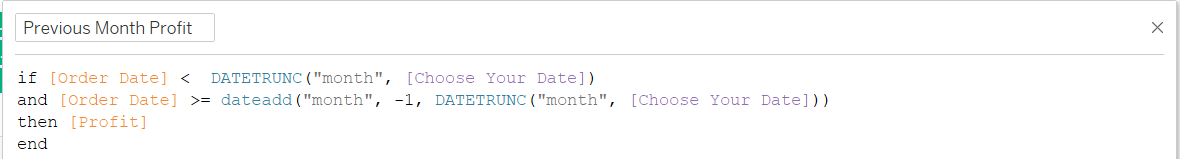
2) Then let's create another calculated field for the total profit for the previous month - return profit for all the dates that are greater than or equal to the 1st of last month and less than the start of next month.
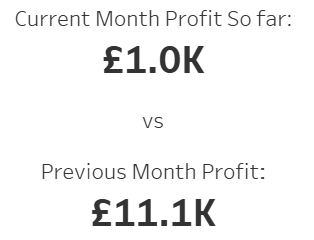
3) Drag your new calculated fields onto the label mark and format as you wish!
4) We can even go a step further and create a chart showing how much more profit we have to make to match last month's performance. Let's start a new sheet and drag our two calculated fields onto the columns shelf.
5) Then overlay the charts by selecting dual axis and then synchronise.
6) Change the mark type of both charts to bars.
7) Make any formatting alterations you wish! I've changed colours, made the previous month's profit more transparent, added mark labels, adjusted the size of the inner bar and removed axis headings and gridlines.

Hopefully this has been a useful overview of how to add some context to your KPIs using previous time periods!