


Day 3 of Dashboard Week: Exploring Item Prices in Path of Exile
Day 3 brought an exciting and unusual challenge: designing a dashboard using data from poe.ninja about item prices and currency fluctuations in the game Path of Exile. As someone who had never even heard of the game before today, my first task was to hit Google and learn all about it!
Understanding the Task
In Path of Exile, players trade items using in-game currencies, which fluctuate in value depending on player demand. With this in mind, I decided to create a dashboard that:
- Allows users to track an item’s value during a given “season” of the game.
- Shows how different currencies change in value over time.
- Highlights which currency is the best to use on any given day by comparing its value to its historical average.
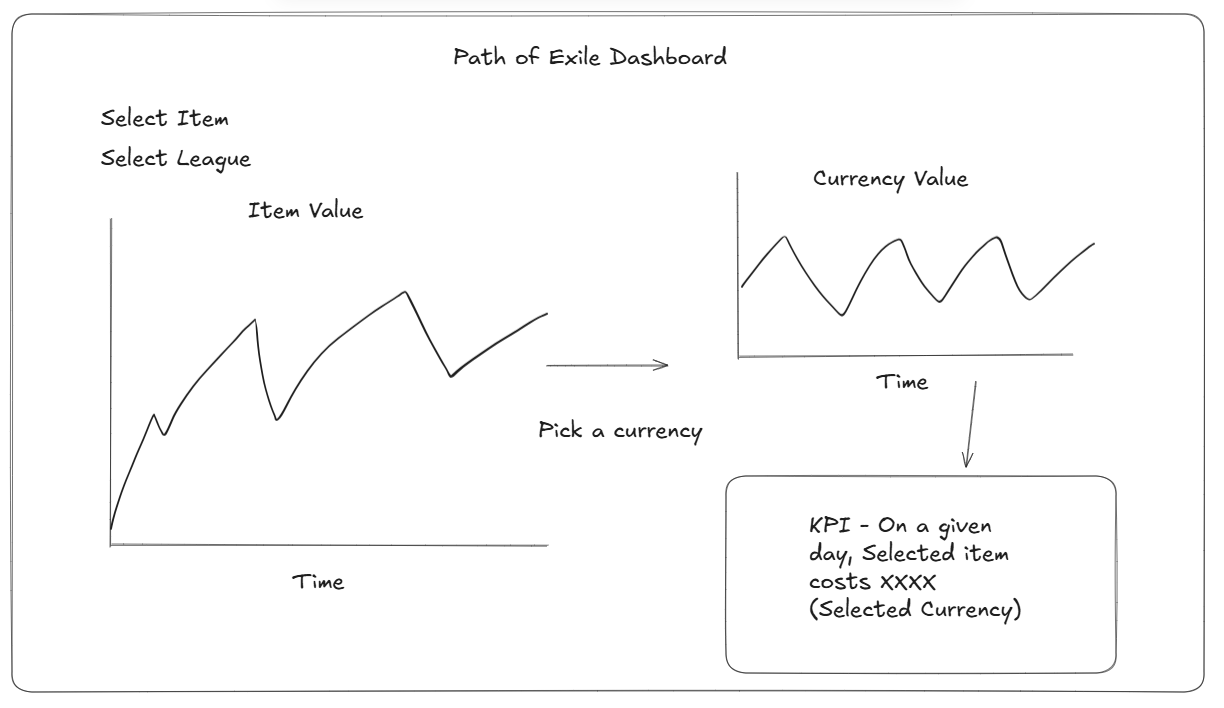
Here’s a look at the initial plan I sketched out:
Building the Dashboard
Once I had a clear direction, I got to work on the data. I used fixed LOD calculations to convert real-world dates into “season age” values in days, which would allow users to see trends specific to each game season.
Next, I built the charts, using parameters and parameter actions to enable interactivity between them. This way, users could explore how item and currency values change over time in a seamless and engaging way.
The Final Result
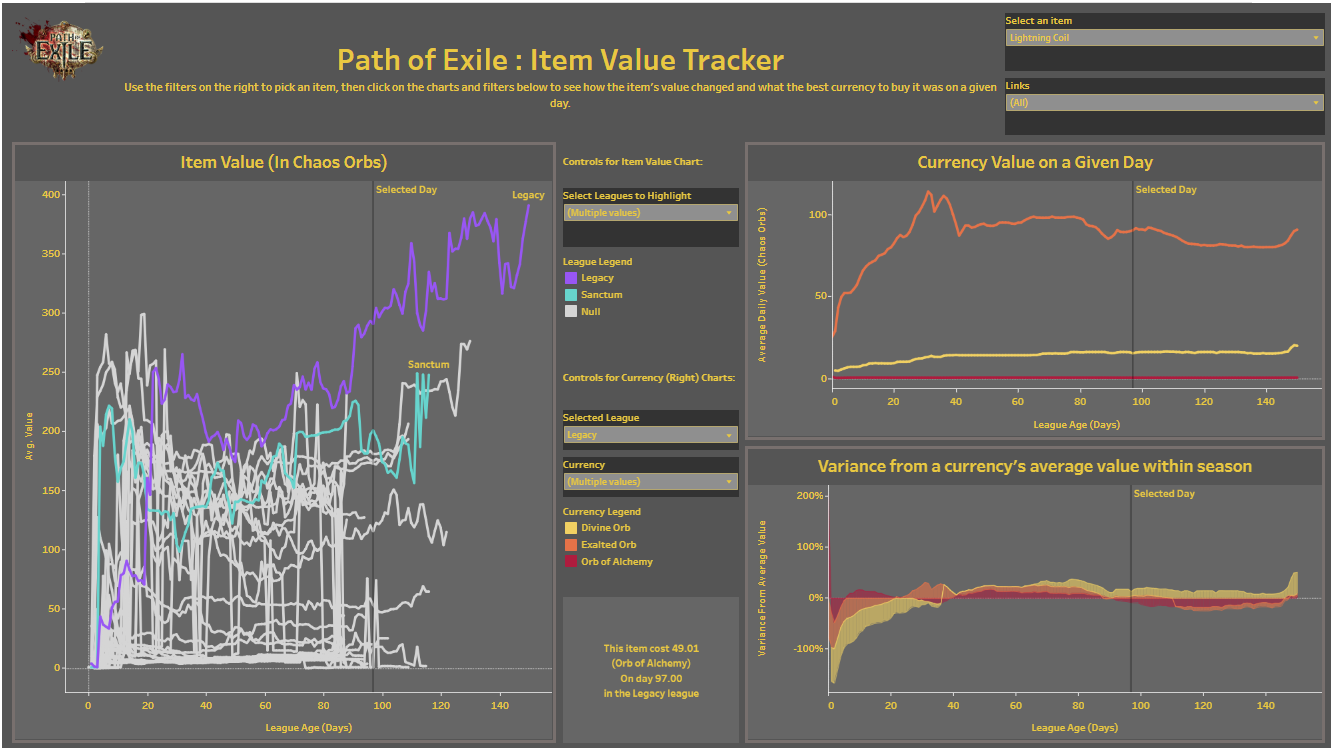
Here’s the final dashboard I presented:
Takeaways
This project pushed me to step into a completely unfamiliar context, and it was a great reminder of how data visualization can make complex systems (like a game economy) more approachable.