Well, that was stressful.
Most of today was spent struggling with working out how to get the data ready for Tableau. I think I only opened Tableau at about 13:30 once I had data to work with, leaving me with two hours to create a dashboard.
THE DATA
Today we were looking at flights in and out of San Francisco International Airport. There was a json file for each flight, each day for the past 14 years. As you can imagine, my first idea of downloading the zip file and extracting it in my file explorer went awfully.
After trying this same strategy four times and expecting a different outcome, I thought it’d be wise to try something else. Downloading a software that allowed me to just extract and download parts of the file seemed to do the job. I didn’t know what I wanted to show yet, or even what the data contained, so I decided to just take the most recent month of full data (March 2020).
The next few hours were spent in Alteryx trying to figure out a way to bring all of these json files together. After a lot of struggle and help we finally managed to create a batch macro followed by a crosstab to output the data, with each row being a flight’s information.
Finally, I could actually look at the data to see what I was working with. There were only a few columns which both contained data and had understandable headers, so I had to make the best of these fields.
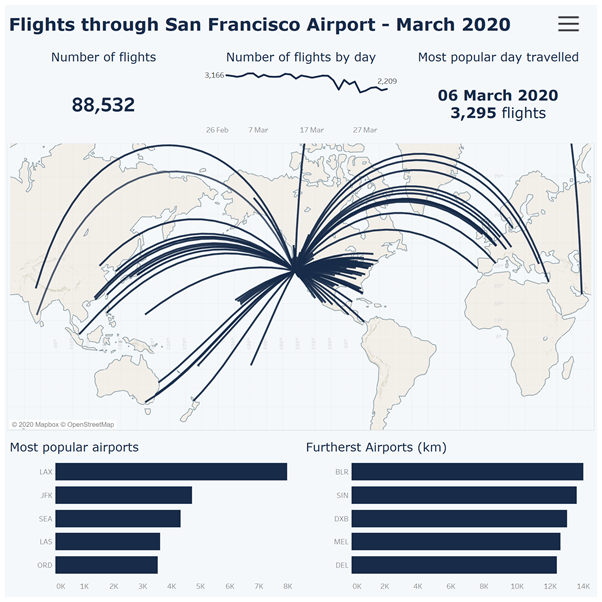
The requirements for this dashboard were to create a KPI dashboard that includes a customized Mapbox map. I didn’t have time to search around, so quickly found the first map I liked the look of.
The map was the focus of my dashboard, and so I put some KPIs above it and some bar charts below. This wasn’t too time consuming, but my dashboard lacked any sort of interesting insights.
So, I decided to add some filters and dashboard actions that affect the KPIs and charts, allowing the user to explore the data themselves through the dashboard.
I’m happy with the outcome of the dashboard, given most of the day was spent in Alteryx.
Thanks for reading and here’s the final dashboard 👍