Looking back at today, I’m not sure how it went by so quickly. The requirements were to make a KPI dashboard in both Power BI and Tableau. Andy mentioned that the data prep would be minimal today, which was a relief as I think I was still scarred from yesterday’s dataset. Having no experience with Power BI, today presented itself with some very different challenges compared to the previous days.
THE DATA
Today the data was on long-term productivity and growth for a selection of countries. Fortunately, the data prep was fairly simply, just requiring a couple of tools in Alteryx to bring some Excel sheets together.
I decided to start in Power BI, as I expected to run out of time towards the end of the day and felt I would’ve been much more comfortable creating a Tableau dashboard under time pressure than a Power BI one. I’m glad I did it this way because, as I expected, I spent far too long in Power BI. I think my first mistake was going into it with the idea to make something I knew I could make in Tableau. Looking back, I should’ve tried to start with the basics and build on it rather than trying to use a parameter within the first 5 minutes.
I wanted to create a dashboard that specifically looked at the period before, during and after the financial crisis 07/08. The dashboard would use a parameter so a user could choose a country and all of the information would display for the chosen country.
I’m still not sure how I’d do this, or even if a parameter is necessary, but it was a good experience trying to learn something brand new within a time limit.
I had to settle for a dashboard looking at only the UK, as I had no more time to spend on Power BI.
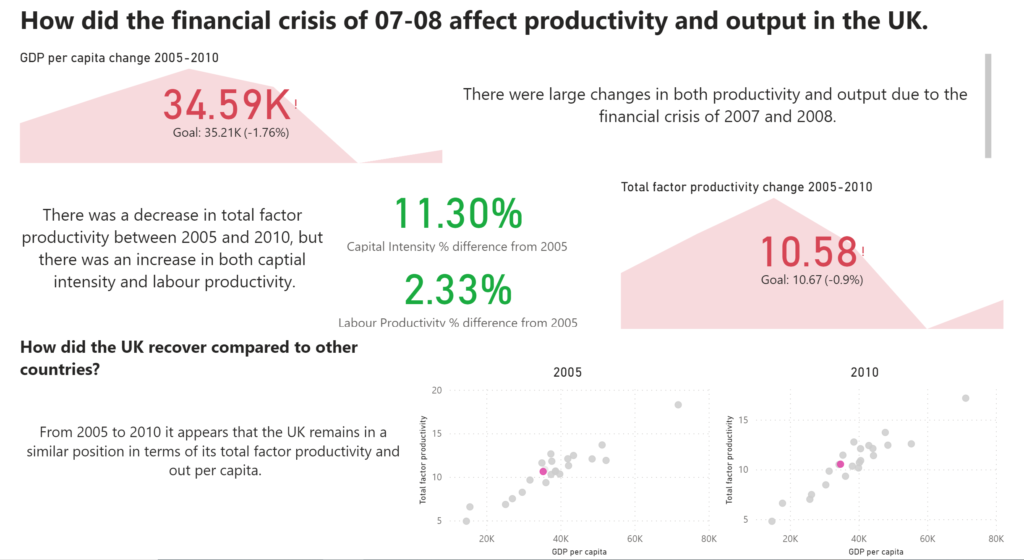
Here’s my final dashboard for Power BI. No need for me to provide a link as the screenshot is as interactive as the dashboard gets…

With about two hours left to create my Tableau dashboard, I knew it wouldn’t be the best. I decided to use the same idea I had for Power BI, but hopefully I wouldn’t have any problems with visualizing this in Tableau. For the most part, this was ok, but I didn’t completely finish because of how little time I left myself with.
Overall, I think I underestimated how difficult it would be to learn enough in Power BI to produce a whole dashboard. However, when I think back to my first day looking at Tableau, it was a similar experience.
Thanks for reading and here’s the final dashboard 👍

