


For this example I will be using the US Superstore Date Set to display the SUM of Sales by Month of Order Date.
This guide will break the process down into 4 sections:
- Creating our DATETRUNC
- Creating the Start Date and End Date Parameters
- Creating our Boolean Calculated Field
- Creating our SUM of Sales Calculated Field to display
Creating our DATETRUNC
Open a Calculated Field and DATETRUNC the Order Date.
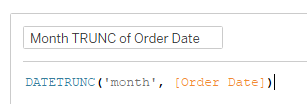
What this calculation is doing is Truncating all the Order Dates to the first of the month. So if we drag this onto view you can see that even though the first row of data has an Order Date of 03/01/2019, the Month TRUNC of Order Date is returning 01/01/2019:
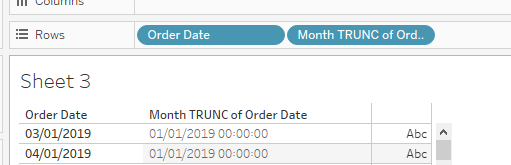
(The reason that the Month TRUNC of Order Date calculation also has a time showing is that Tableau automatically creates this with a data type of Date & Time). DATETRUNC can also be used to Truncate a Date to day, week, quarter or year, but in this scenario we want it to be month. If we were to use the DATEPART function here it would be able to return us the Month, however it would not take the year into consideration. Therefore it is good practice to use DATETRUNC instead, as this will give us much more flexibility when using data set spanning more than one year. A full explanation of DATETRUNC, DATEPART and the other main date functions can be found here - https://www.youtube.com/watch?v=DCGb7sczUWY
Creating the Start Date and End Date Parameters
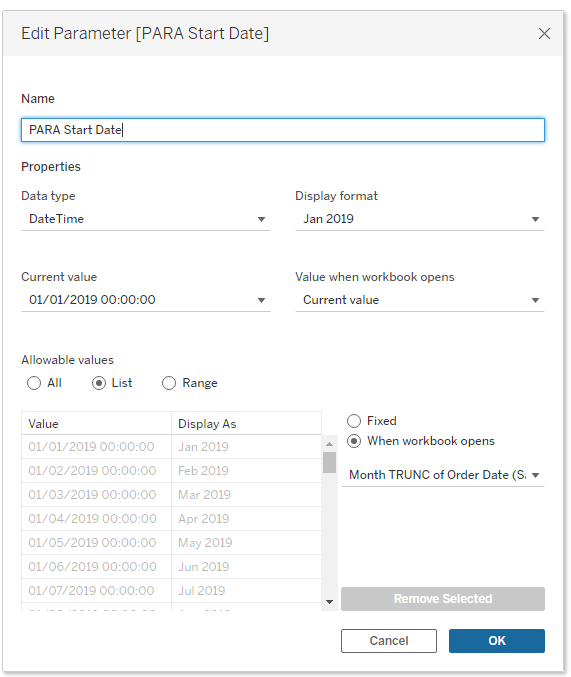
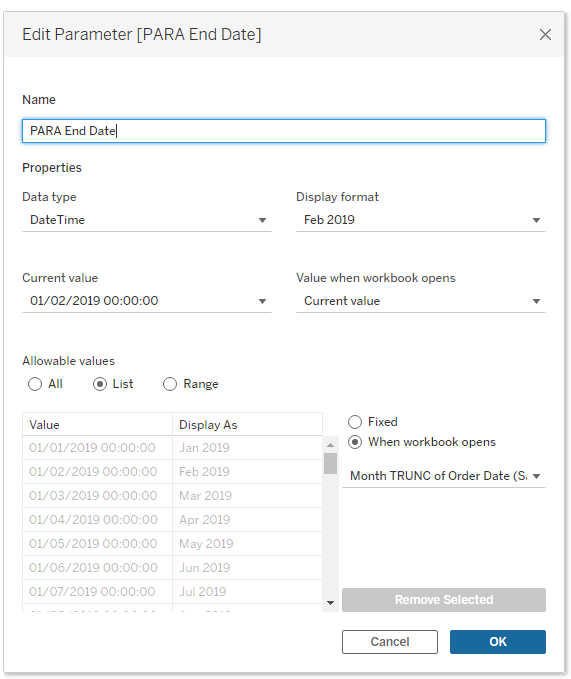
We want to user to have the ability to pick the start and end month that they want to view. For this we need to create the below Start Date and End Date Parameters (both are the same aside from the titles):
The sections we need to then complete are:
Name: what we want our parameter to be called
DataType: for this we will be using DateTime as the Month TRUNC of Order Date is listed as this data type. If we were to pick date for example, the TRUNC calculation would not show as an option.
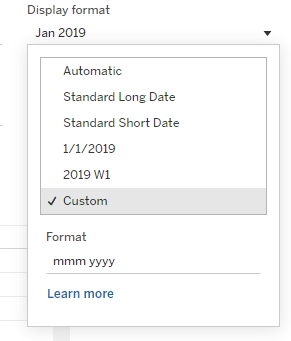
Display Format: we are able to specify how we want our parameter to be displayed. To get the format displayed above I used the custom option and specified 'mmm yyyy':
Current Value: whatever it is currently selected on
Value when workbook opens: this option enables us to choose which months will be selected when the workbook opens (the default month view effectively). For this example we are happy with the current value option.
Allowable Values: for this we want to select List, When Workbook opens and then choose our Month TRUNC of Order Date calculation. By selecting when workbook open it will pull through any updates to our data, for example if new orders had been created. Using Fixed would not enable us to do this.
If we were to try and select the Order Date for the When Workbook opens option we would not be able to display it as just month and year, as displaying like this would create duplicate values:
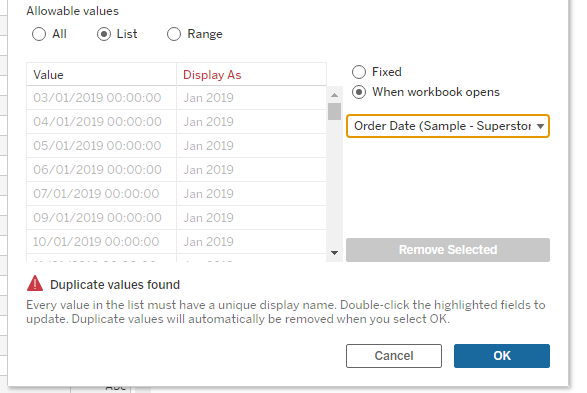
This is why we needed to create the DATETRUNC in our first step.
Creating our Boolean Calculated Field
In order to only view the SUM of Sales within out selected timeframe we first need to create our Boolean to determine what Order Dates fall within that range.
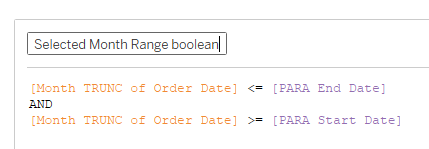
In plain English this calculation is saying, return TRUE for all of the Months of Order Dates that are smaller or equal to our End Date selected and bigger or equal to our Start Date selected.
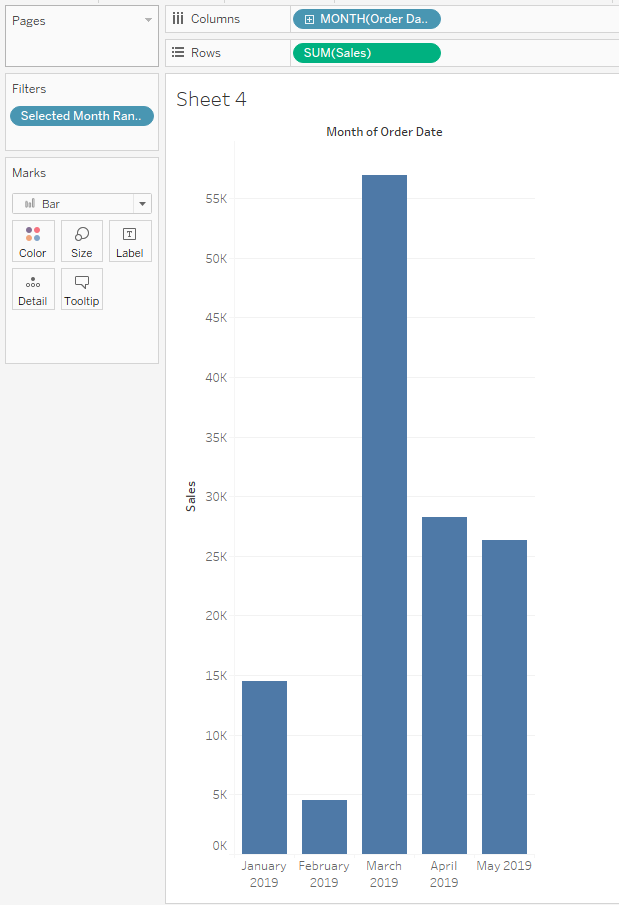
If we build this out onto a table we can see that with 'Jan 2019' selected as the Start Date and 'May 2019' selected as the End Date, it is only returning TRUE for this months equal to these or between these months:
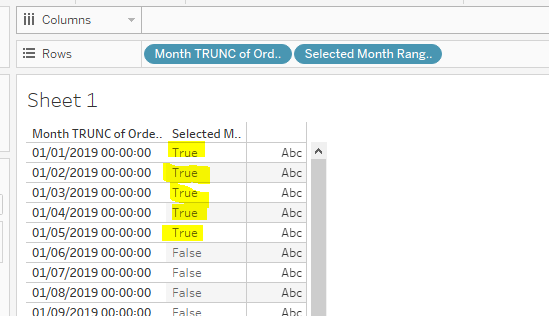
Crucially here it is important to note that as we used DATETRUNC, it is only taking the 2019 months into account, if we had used DATEPART this would not be the case.
Creating our SUM of Sales Calculated Field to display
In this example we want to know the SUM of Sales for our selected range. For this we will create 'Sales for Selected Month Range' using our 'Selected Month Range boolean calculation':
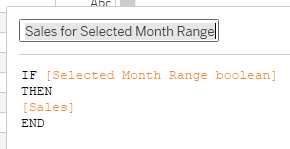
What this is saying, is that for all of our Order Date Months we want to know the SUM of Sales. If we drag this onto our table we can see that it only pulls the SUM of Sales through for those months which are returning TRUE for our 'Selected Month Range boolean' calculation:
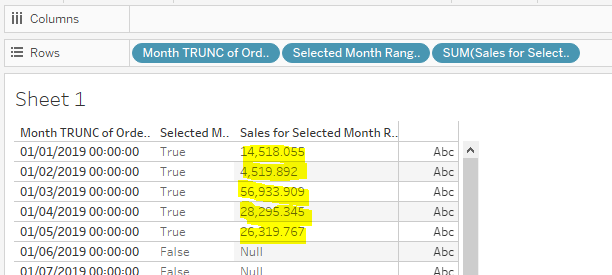
Now we can using this calculation to display as a KPI for the total SUM of Sales in our chose range:
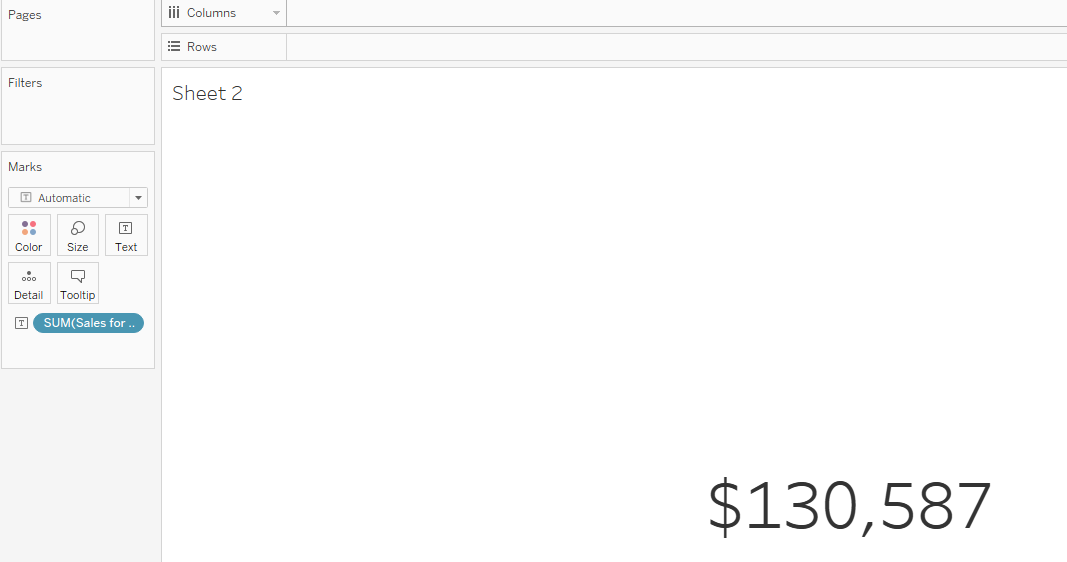
Or we can use this calculation to build out a chart showing the SUM of Sales only for those months in our chosen range:
Please follow the below link for a further guide on how to create and display a dynamic comparison range:
https://www.thedataschool.co.uk/john-power/creating-a-comparison-range-based-off-of-chosen-month-range/