(A video version of this explanation can be found on Andy Kriebel's YouTube Channel - https://www.youtube.com/watch?v=nxCEfvu4D-w)
Finished graph:

In this example we will use the Sample - Superstore dataset.
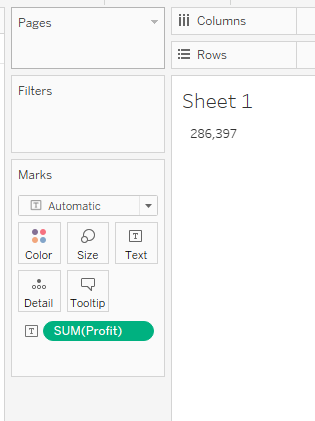
Drag the 'SUM(Profit)' onto the Text card:
Double click on 'SUM(Sales)' and 'SUM(Profit)' as well to add them to Measure Values:
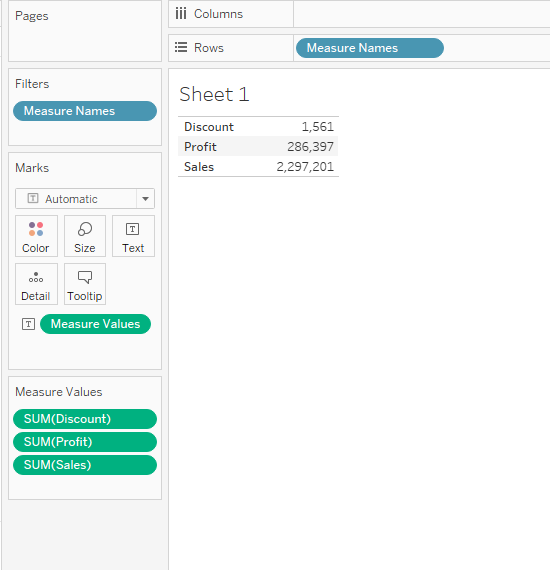
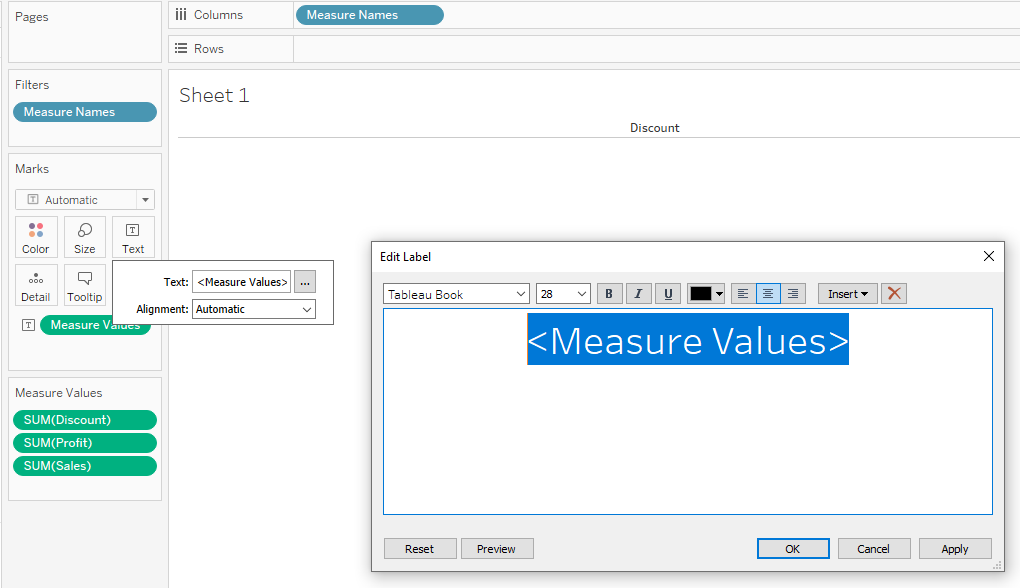
Move the 'Measure Names' from Rows to Columns and change the view to 'Entire View':
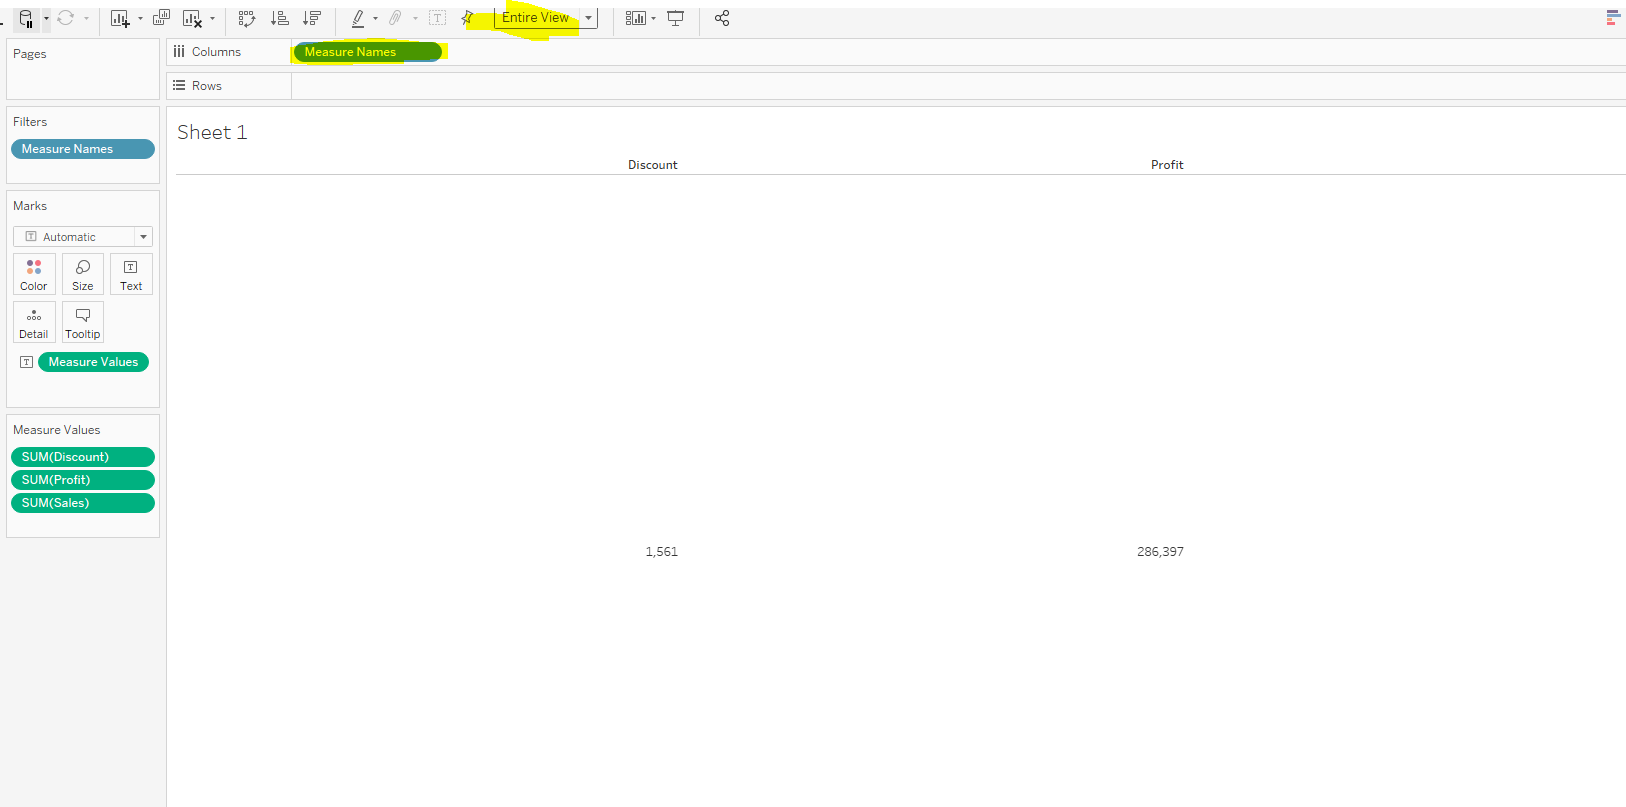
Increase the text size for the 'Measure Values':
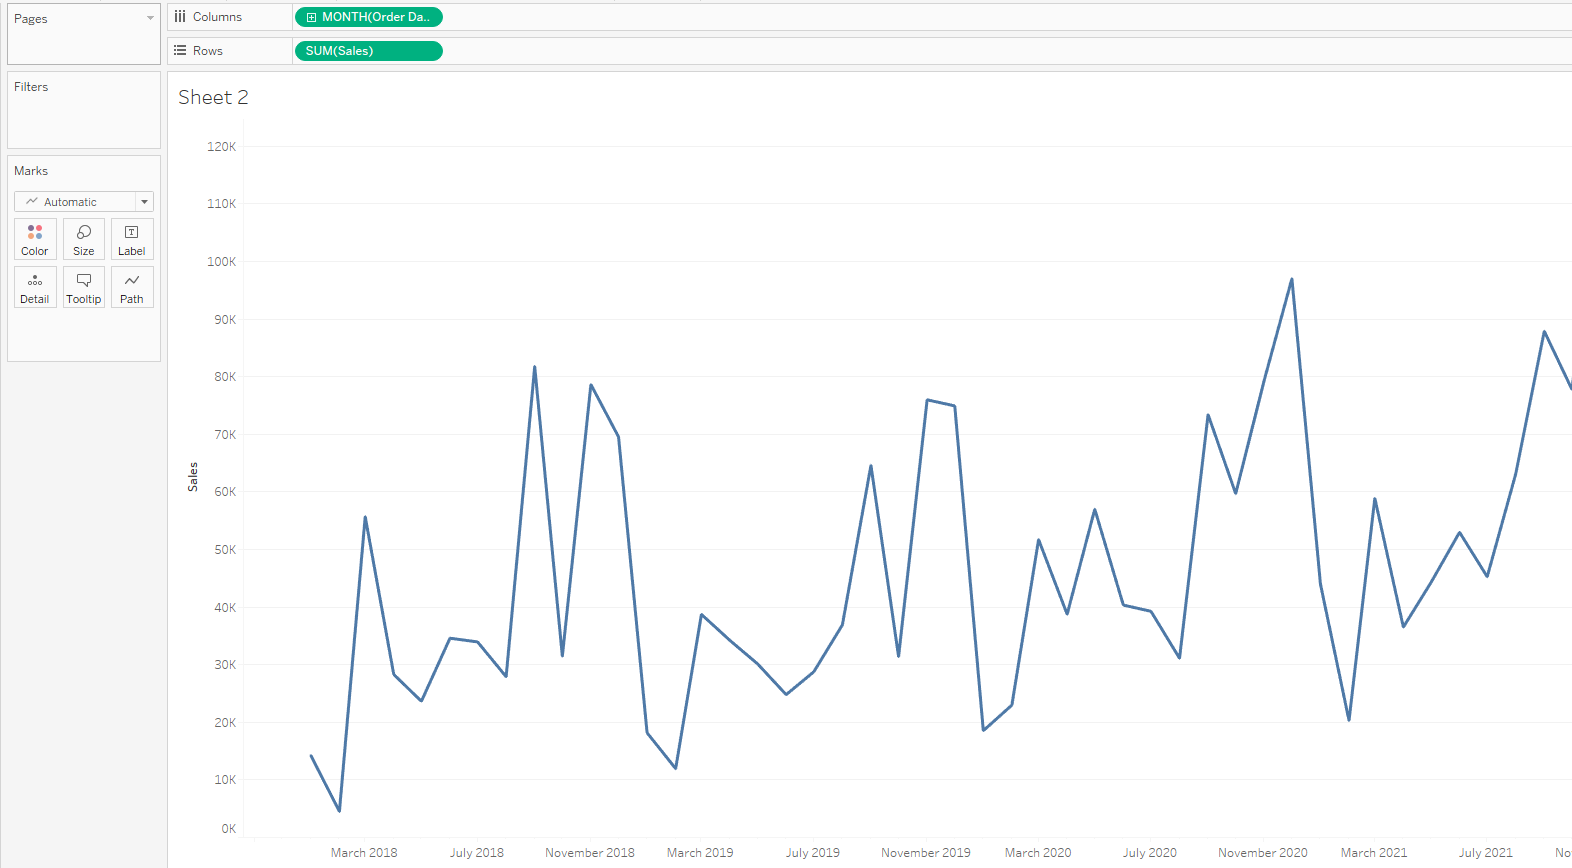
On a new worksheet drag the 'MONTH(Order Date)' onto Column and 'SUM(Sales)' onto Rows to create a line chart:
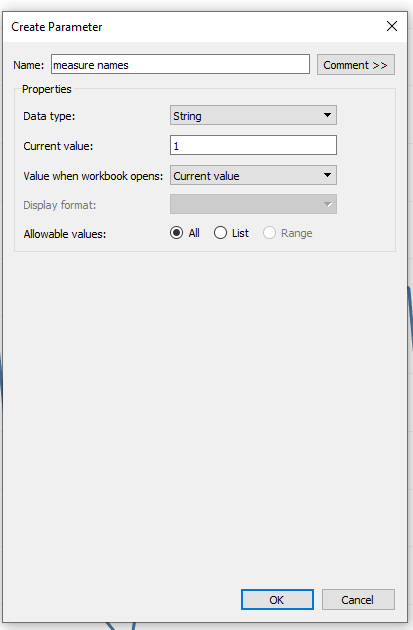
Now we need to create a String Parameter and call it 'measure names':
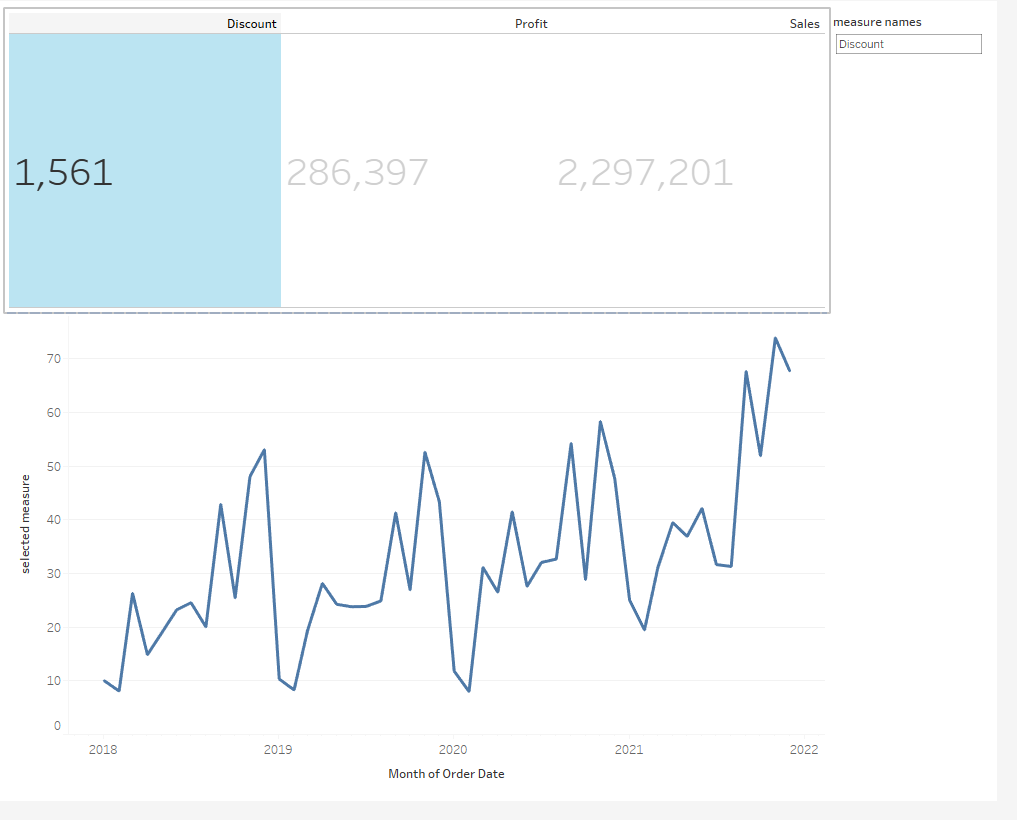
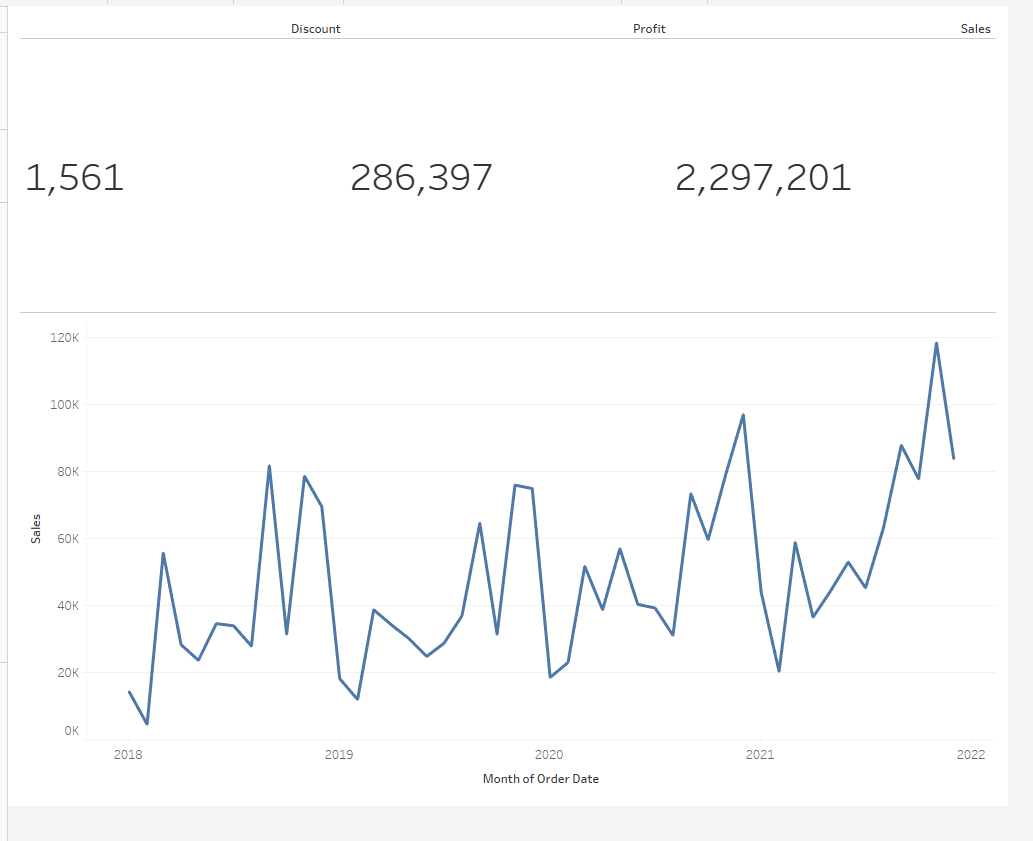
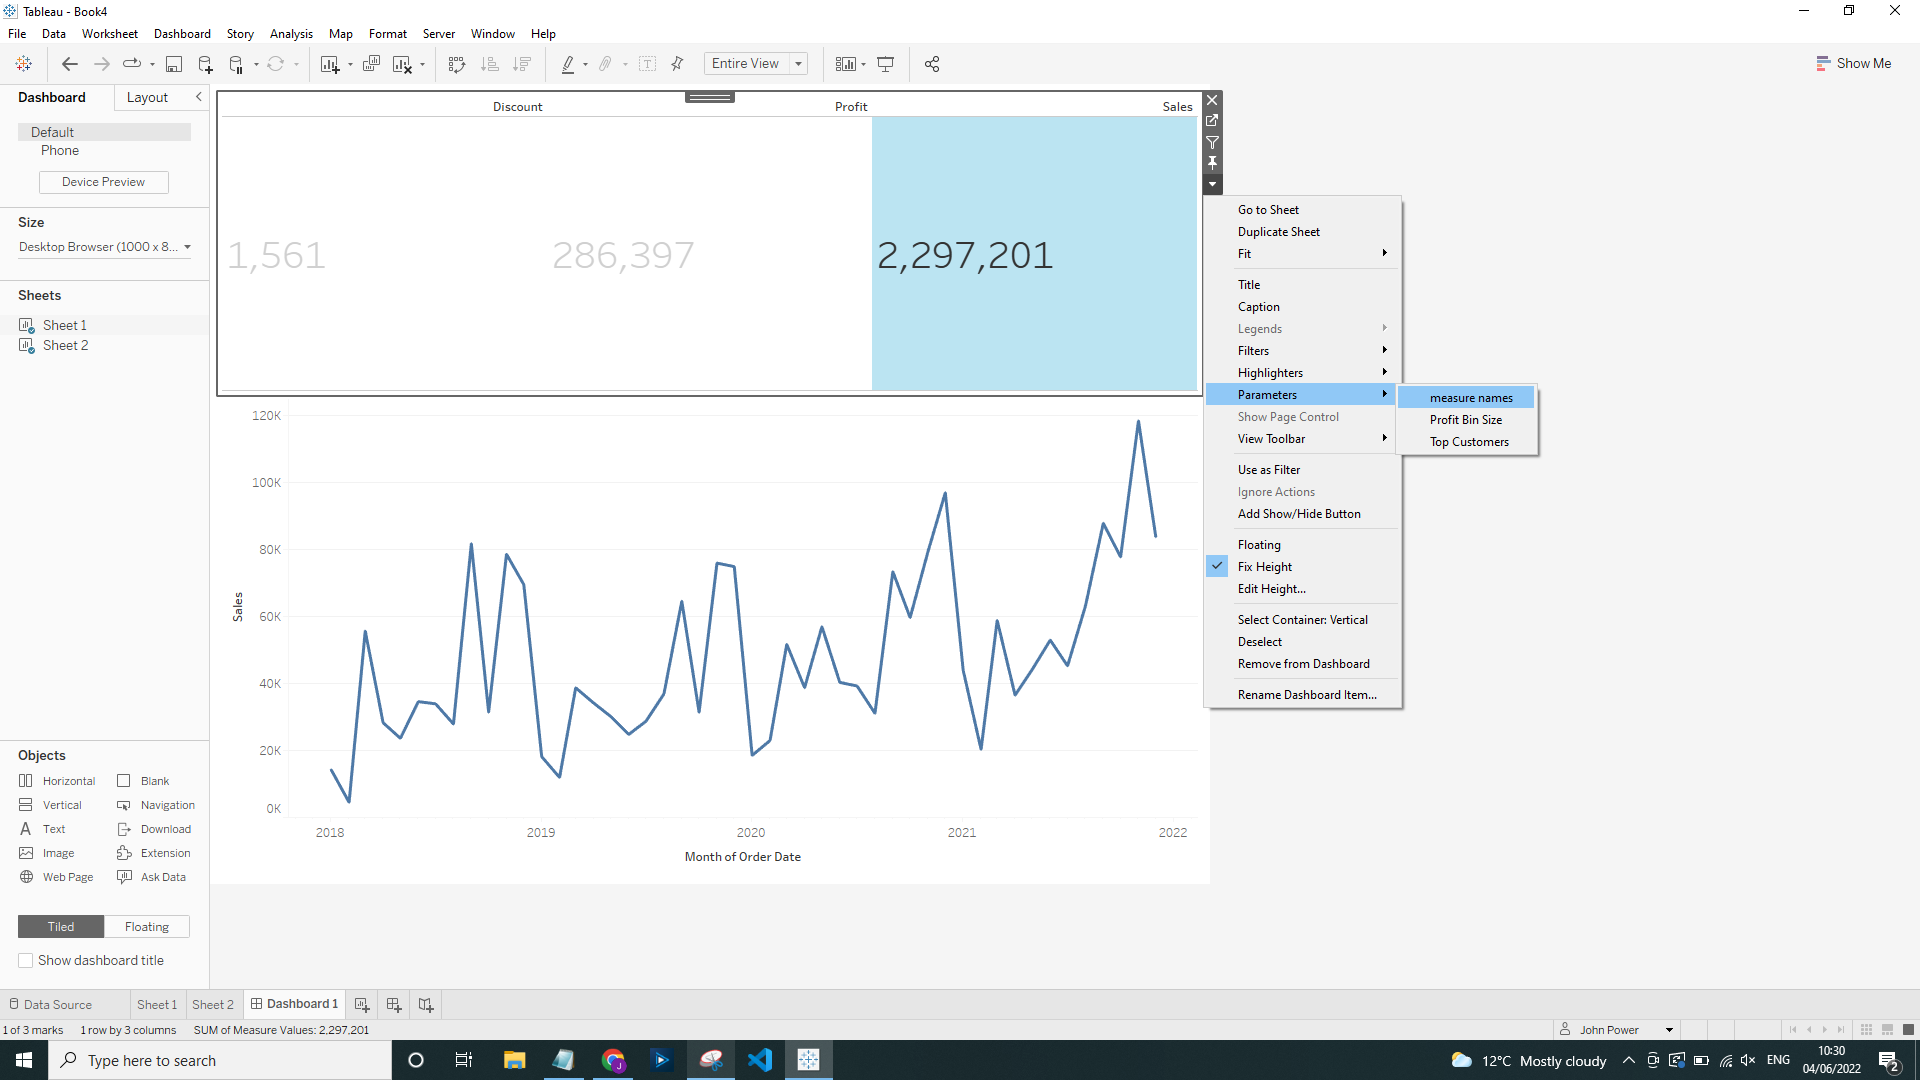
Open up a Dashboard and used the two workbooks to create the below:
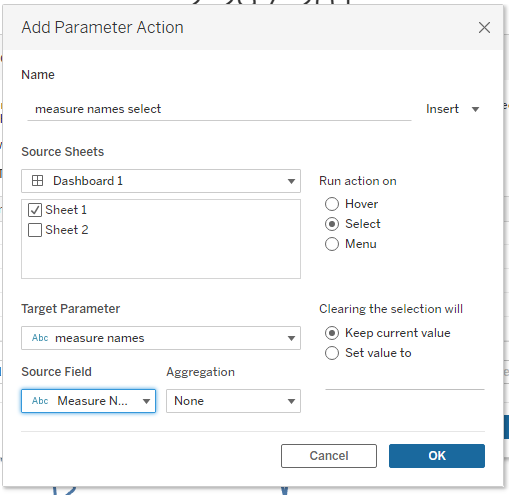
Now for this Dashboard we want to create a Change Parameter Dashboard Action and call it 'measure names select':
Click to show the 'measure names' parameter:
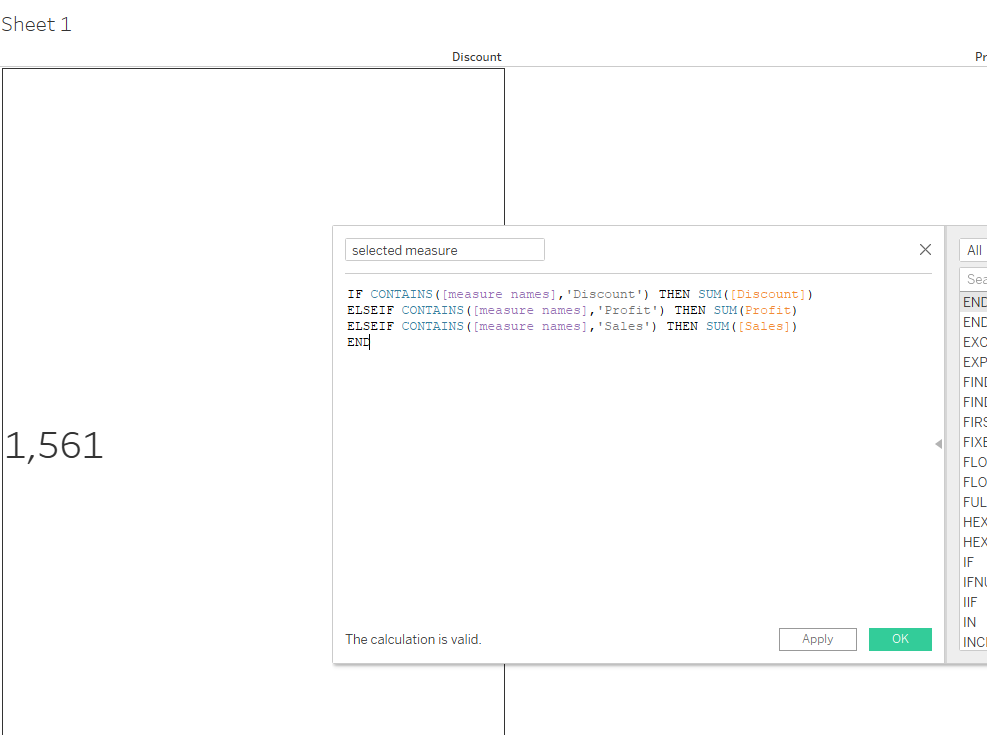
Now when we select each measure name we can see the Parameter updated, however we want to be able to change the graph type using this. So we need to navigate back to 'Sheet 1' and create the below Calculated Field:
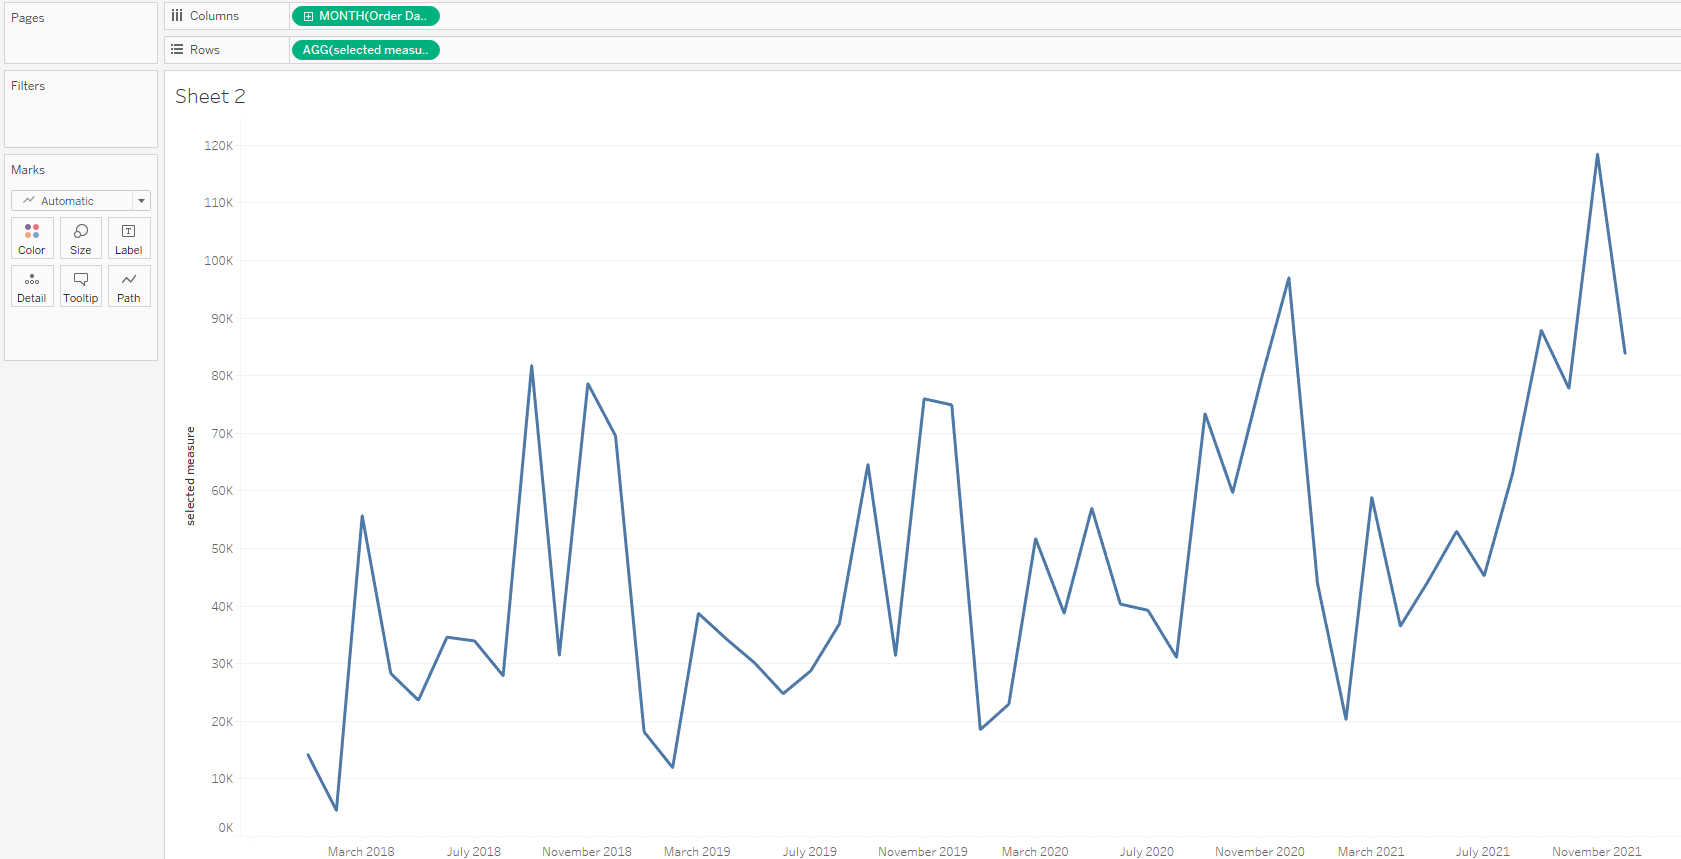
Then on 'Sheet 2' drag this Calculated Field onto Rows instead of SUM(Sales):
Now back on the Dashboard out graph type updates by the measure selected at the top: