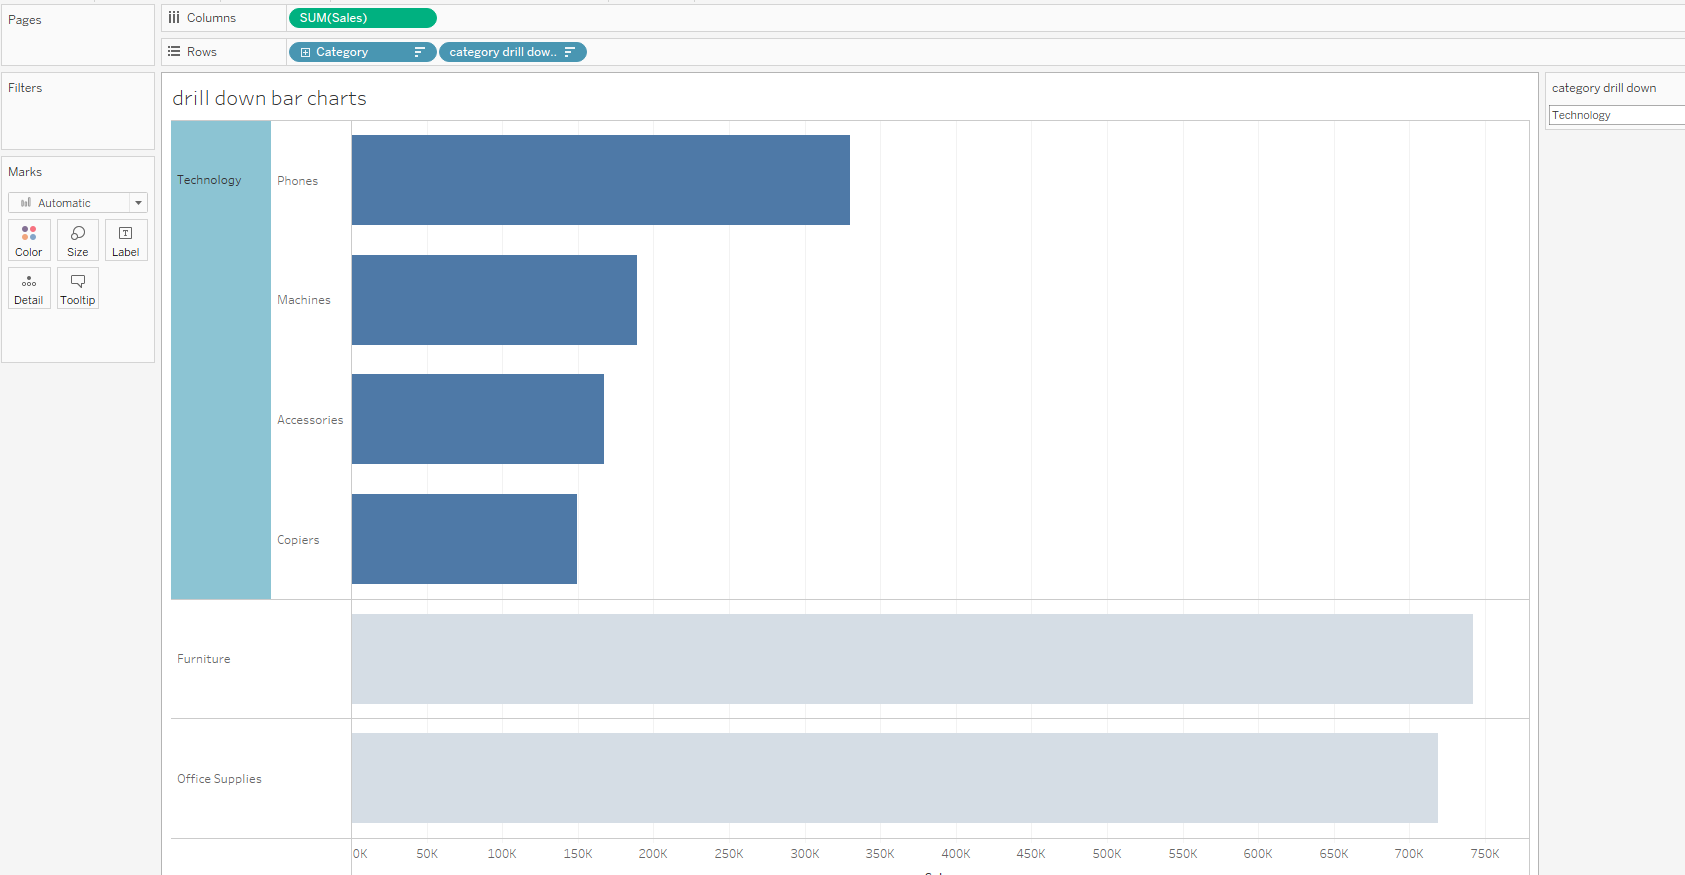
Finished single drill down graph:
In this example we will use the Sample - Superstore dataset.
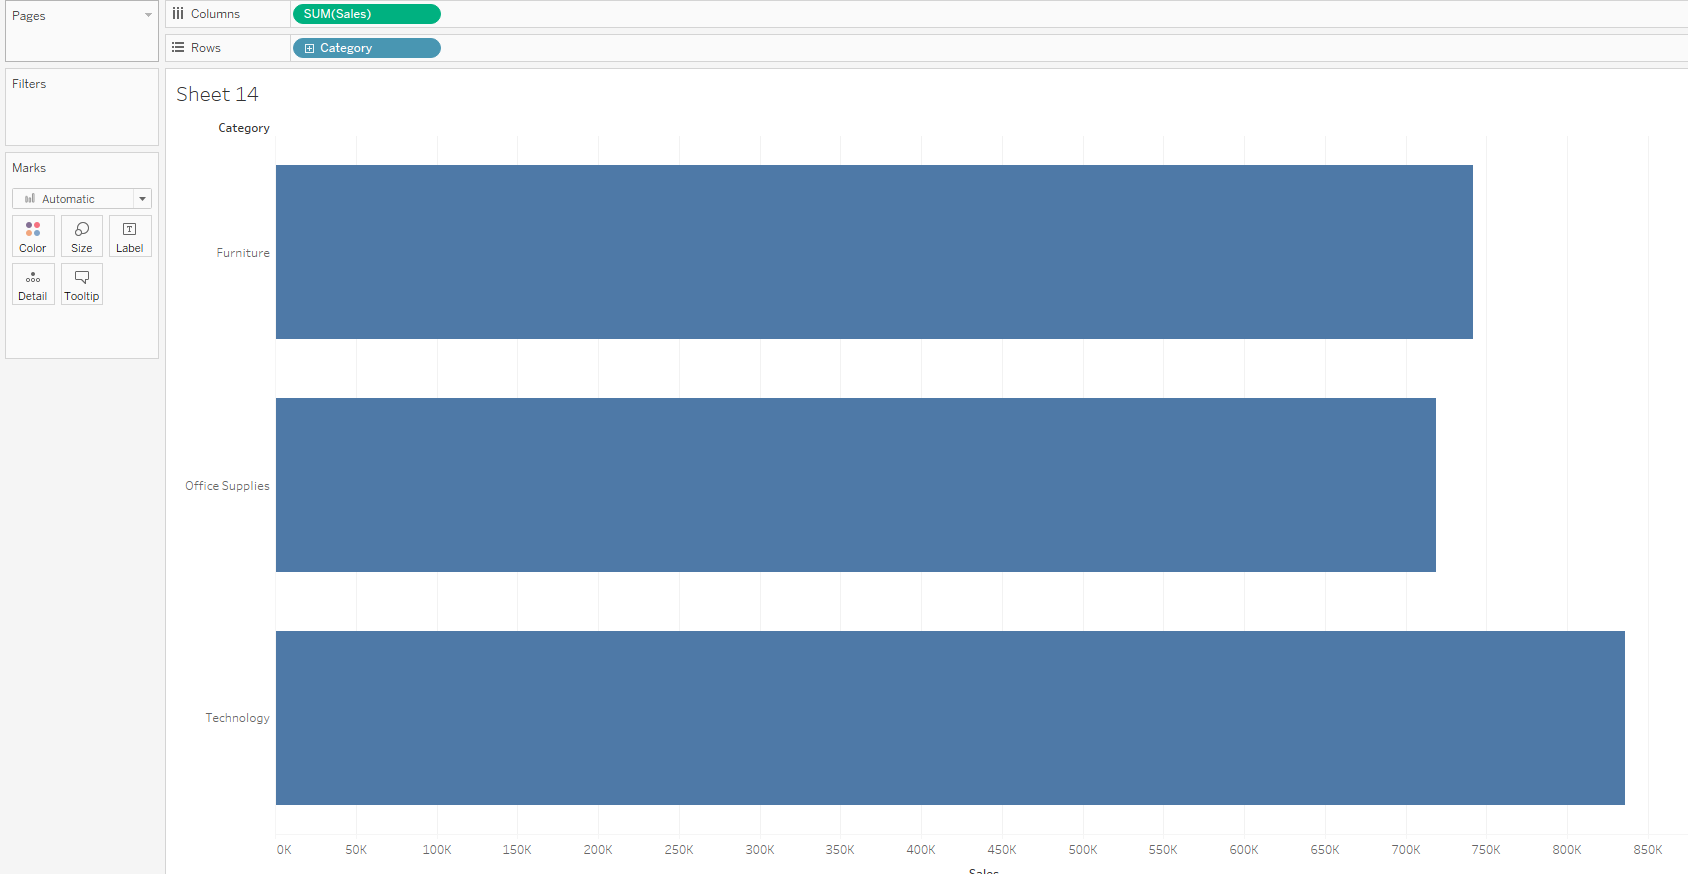
First we need to drag SUM(Sales) onto Columns and Category onto Rows:
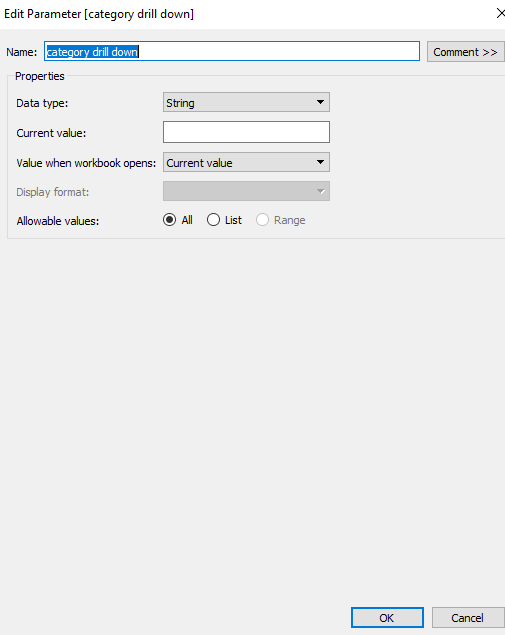
Then we need to create a string Parameter called 'category drill down':
Now we need to create a Calculated Field called 'category drill down':

Then drag the 'category drill down' Calculated Field onto Rows:
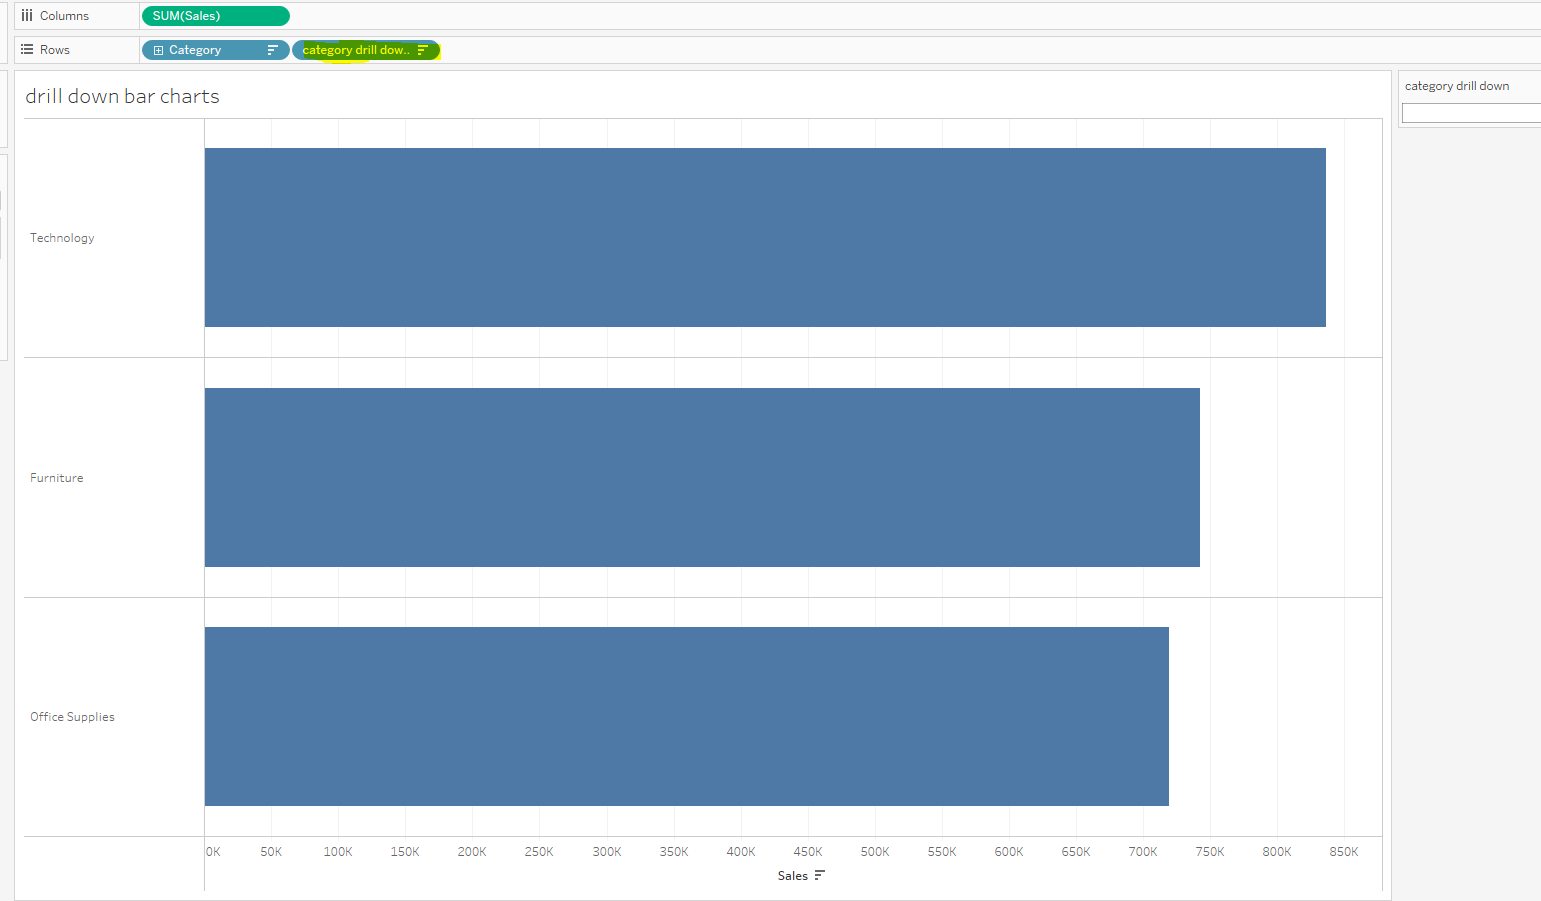
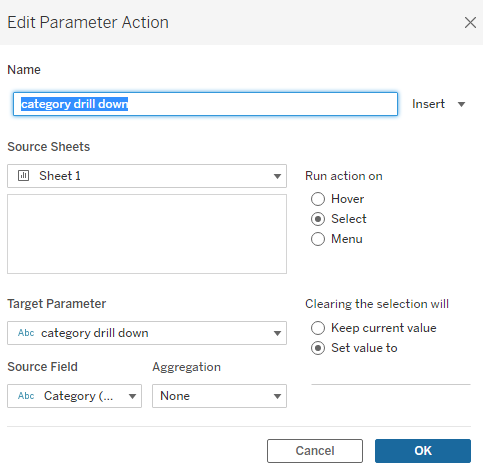
Now we need to create a Change Parameter action for this sheet under the Worksheet tab and call it 'category drill down' and ensure you set the ' clearing selection will' to be 'set value to':
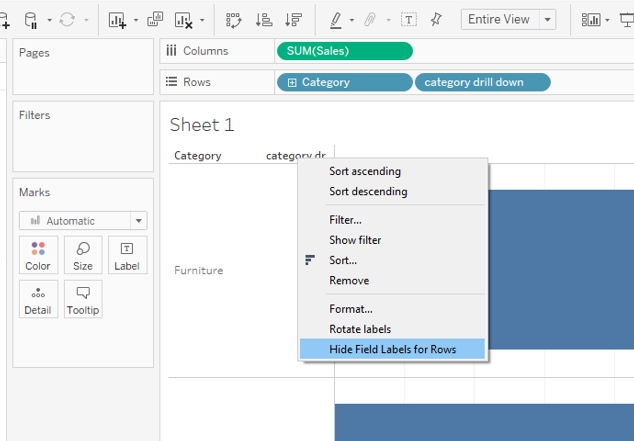
To tidy up our sheet we need to right click on 'category drill down' and select to 'Hide Field Labels for Rows':
Now as we select each Category it will drill down to the Sub-Category:
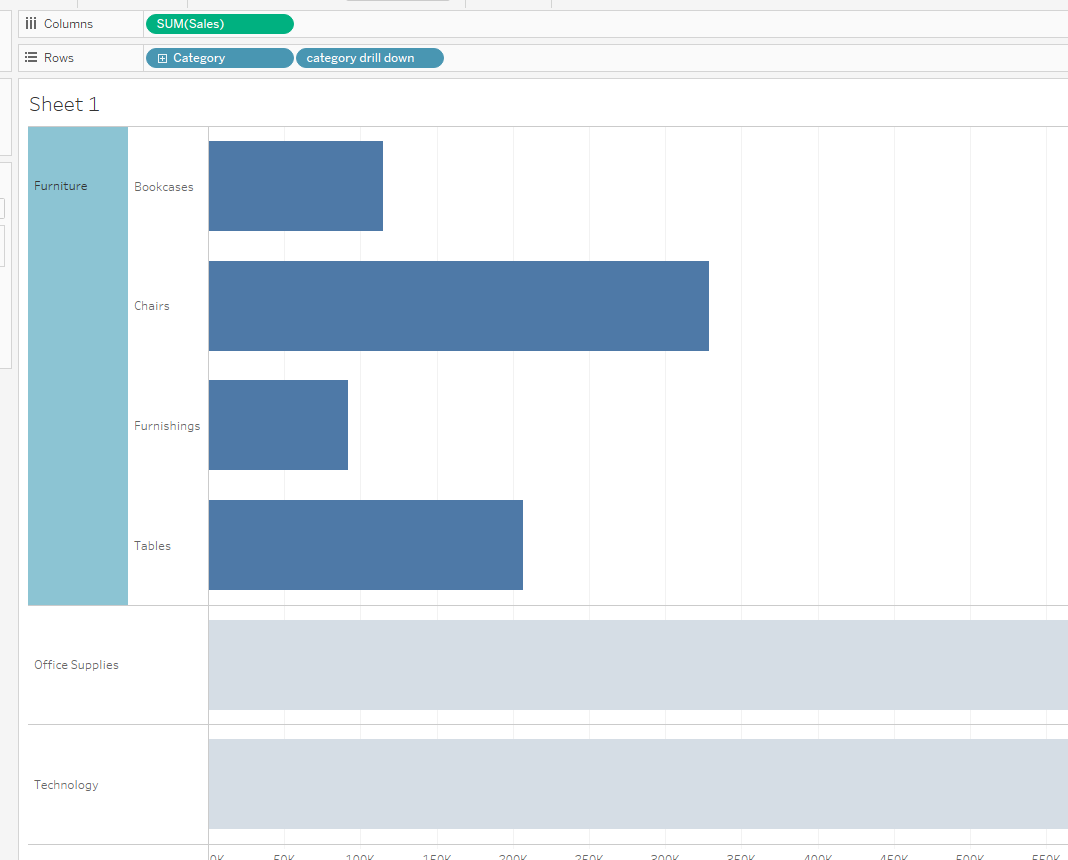
Currently when we select each Category, the unselected Categories turn grey.
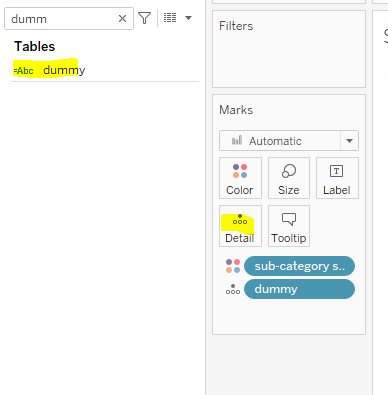
To prevent this we need to create a 'dummy' Calculated Field as below:

Drag this onto 'Detail':
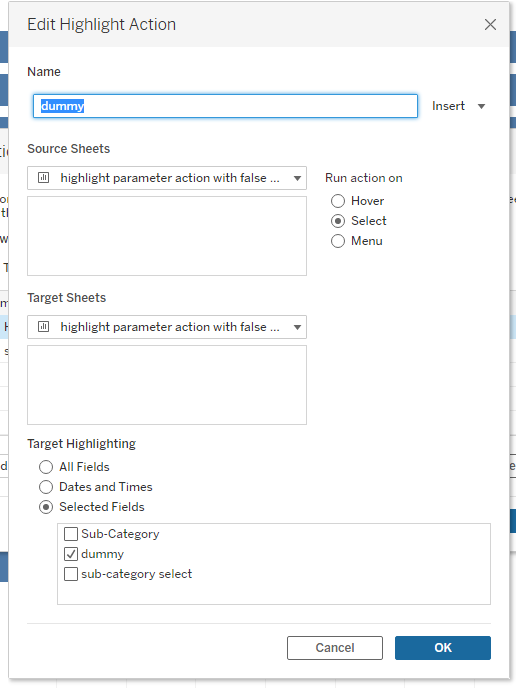
Then create a Highlight Action for this sheet via the Worksheet tab as below:
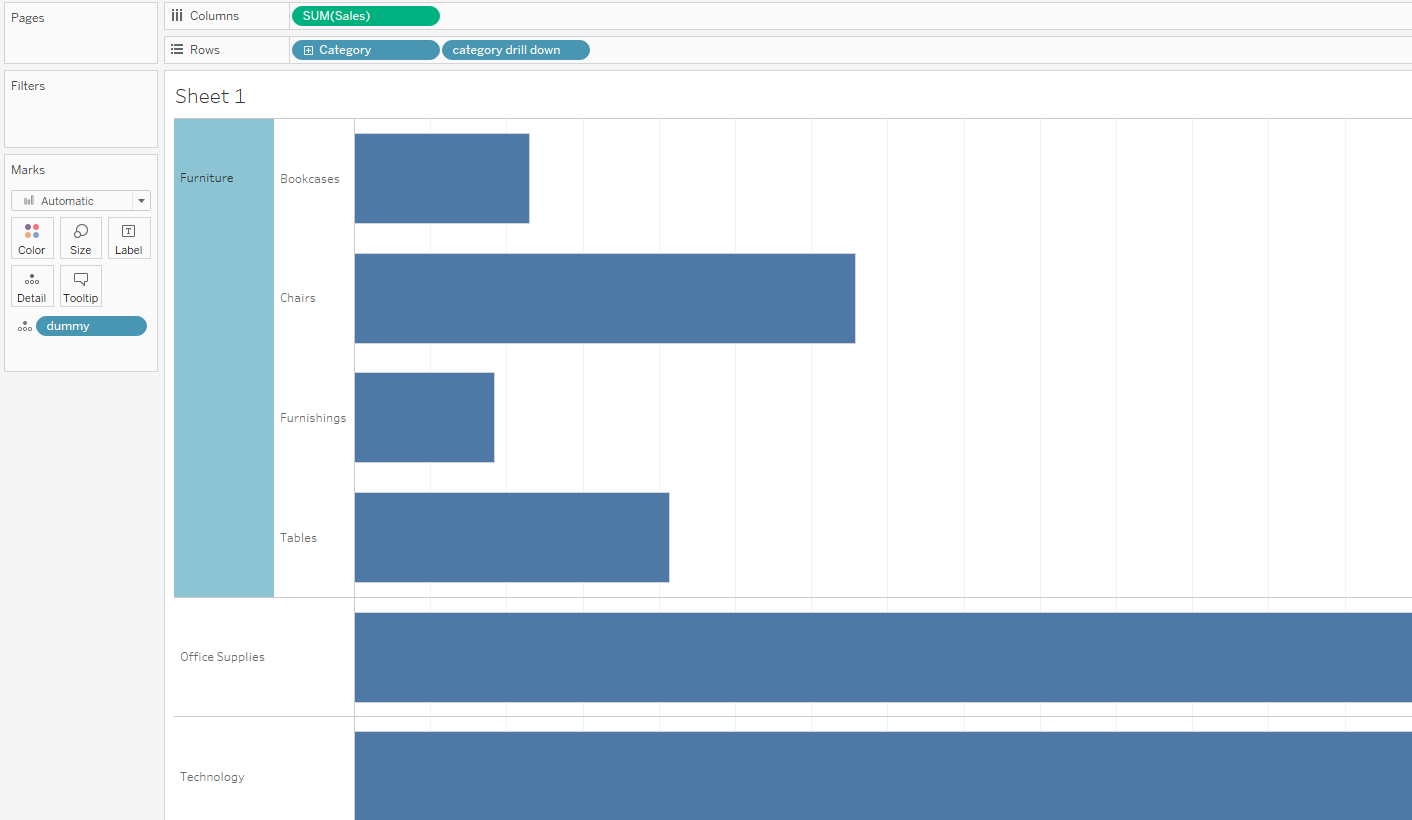
Now when we select each Category the unselected Categories do not turn grey:
STOP HERE IF YOU JUST WANT A SINGLE DRILL DOWN, CONTINUE FOR DOUBLE DRILL DOWN
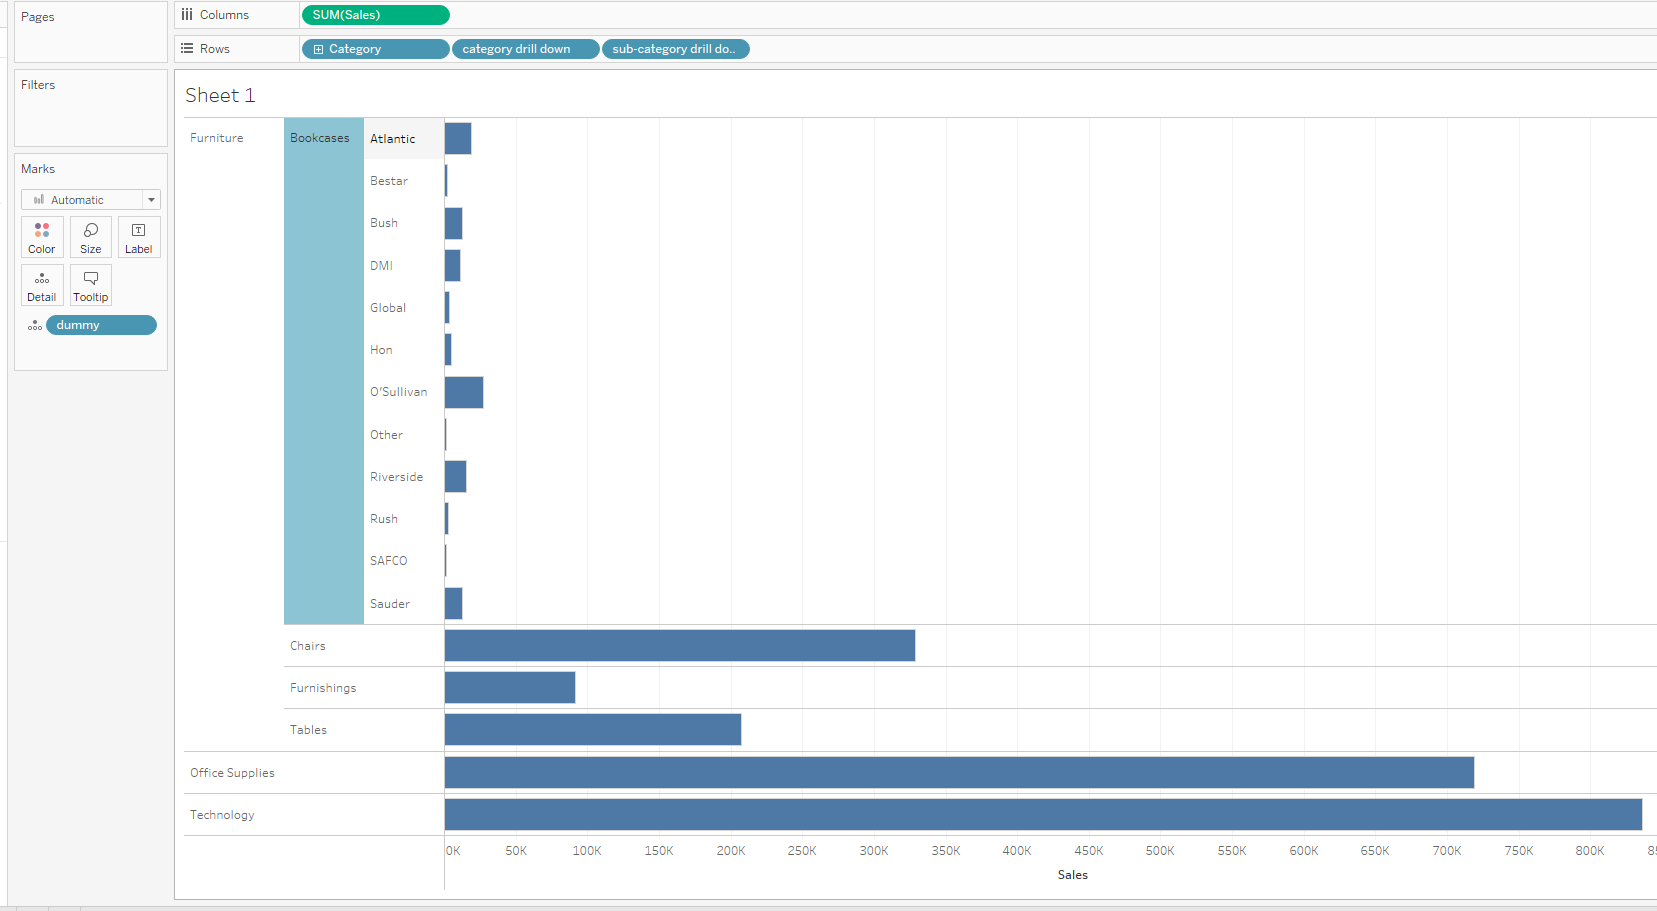
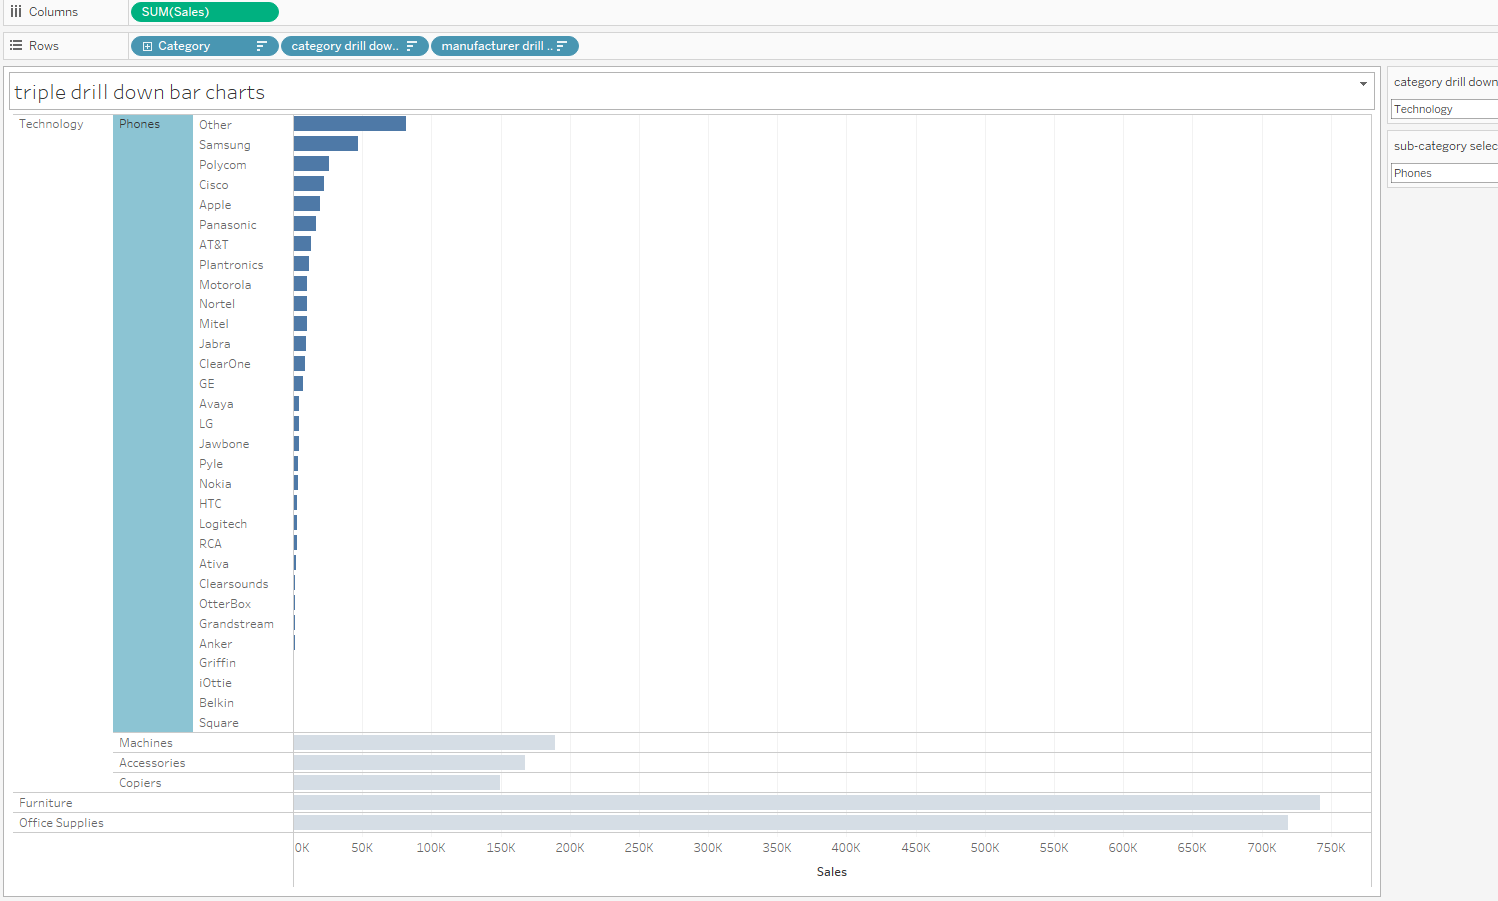
Finished double drill down graph:
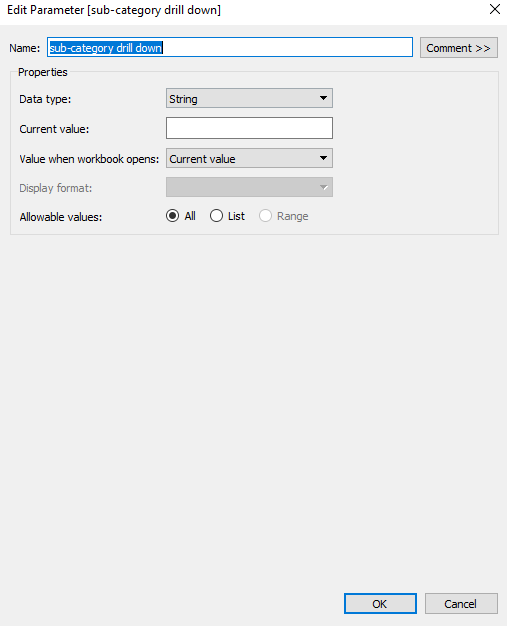
First we need to create a string Parameter called 'sub-category drill down':
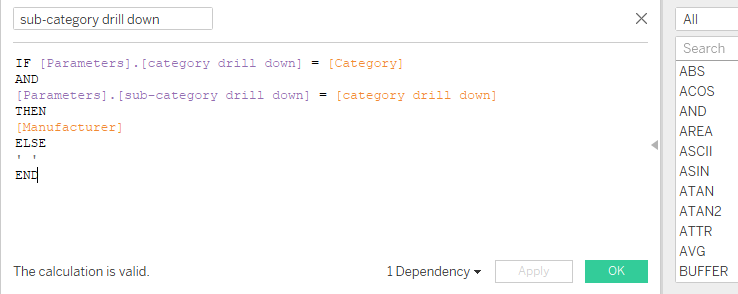
Now we need to create a Calculated Field called 'sub-category drill down':
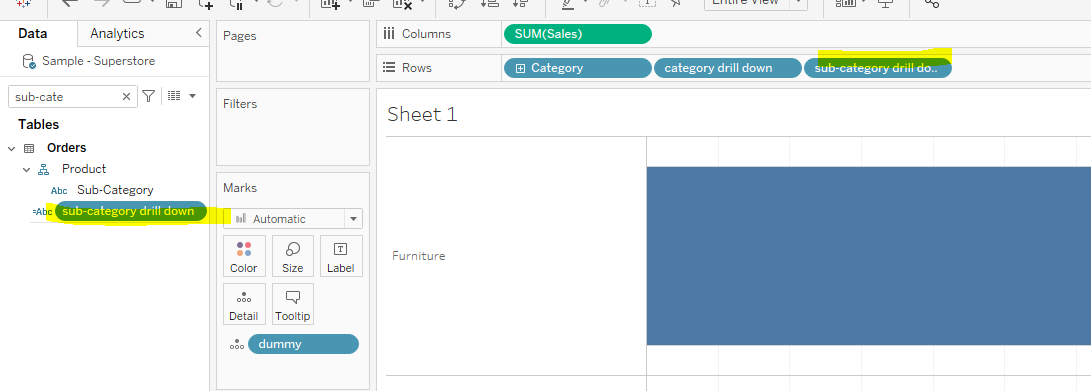
Then drag the 'sub-category drill down' Calculated Field onto Rows:
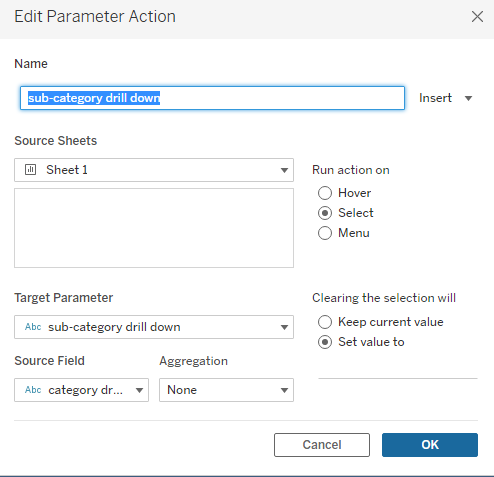
Now we need to create a Change Parameter action for this sheet under the Worksheet tab and call it 'sub-category drill down' and ensure you set the ' clearing selection will' to be 'set value to'. Also ensure that the source filed you art targeting is 'category drill down':
Now you will be able to drill down from Category to Sub-Category to Manufacturer:
