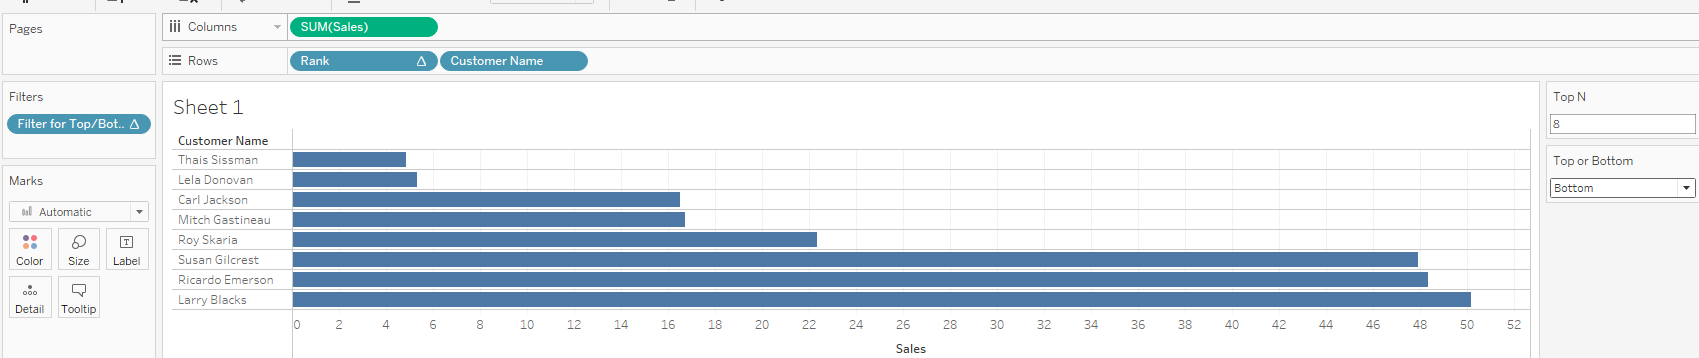
Finished chart:

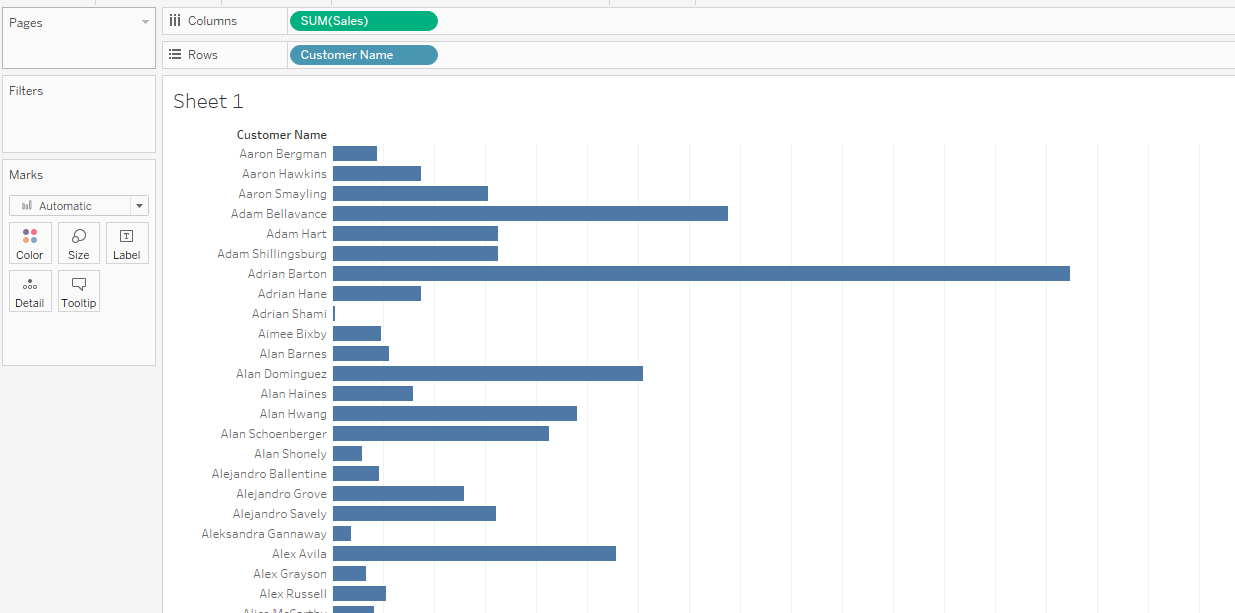
In this example we will use the Sample - Superstore dataset.
First we need to drag 'SUM(Sales)' onto Columns and 'Customer Name' onto Rows:
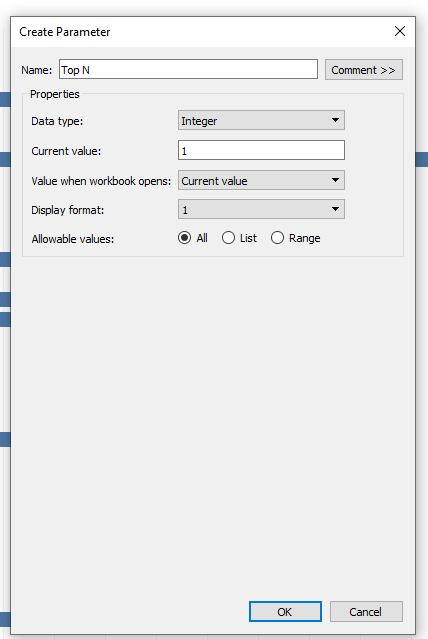
Now we need to create a Integer Parameter called 'Top N':
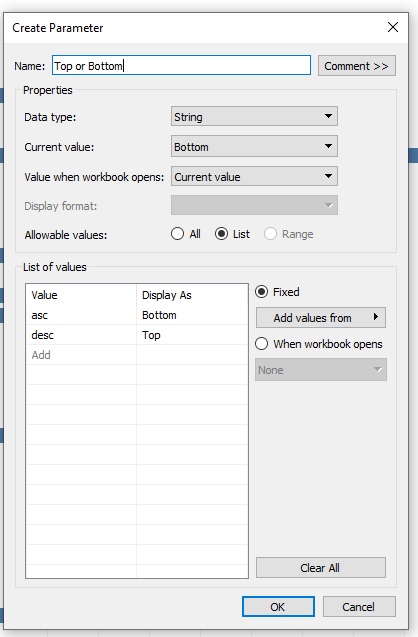
We now need to create a String Parameter called 'Top or Bottom', but this one needs to be a list as below:
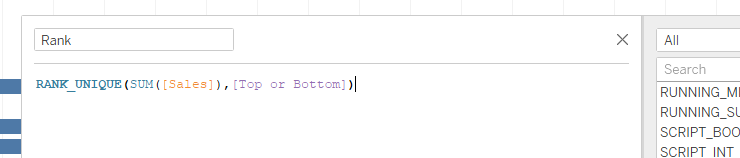
Now we need to create a Calculated Field called 'Rank':
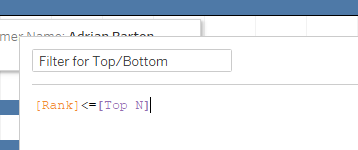
We now need to create a second Calculated Field called 'Filter for Top/Bottom':
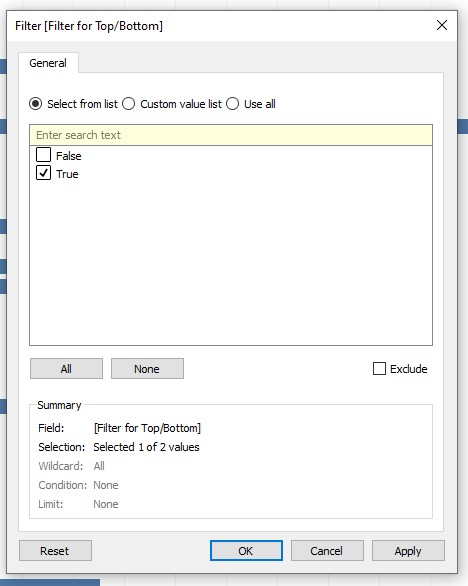
Now we need to drag this Calculated Field onto the filter and select 'True':
Drag the 'Rank' Calculated Field onto Rows and change it to be Discrete and right click to untick 'Show Header':
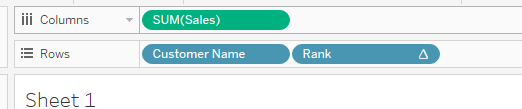
Move the 'Rank' Calculated Field to the left of the 'Customer Name' on the Rows, then right click on both the 'Top N' and 'Top or Bottom' parameters to show them:
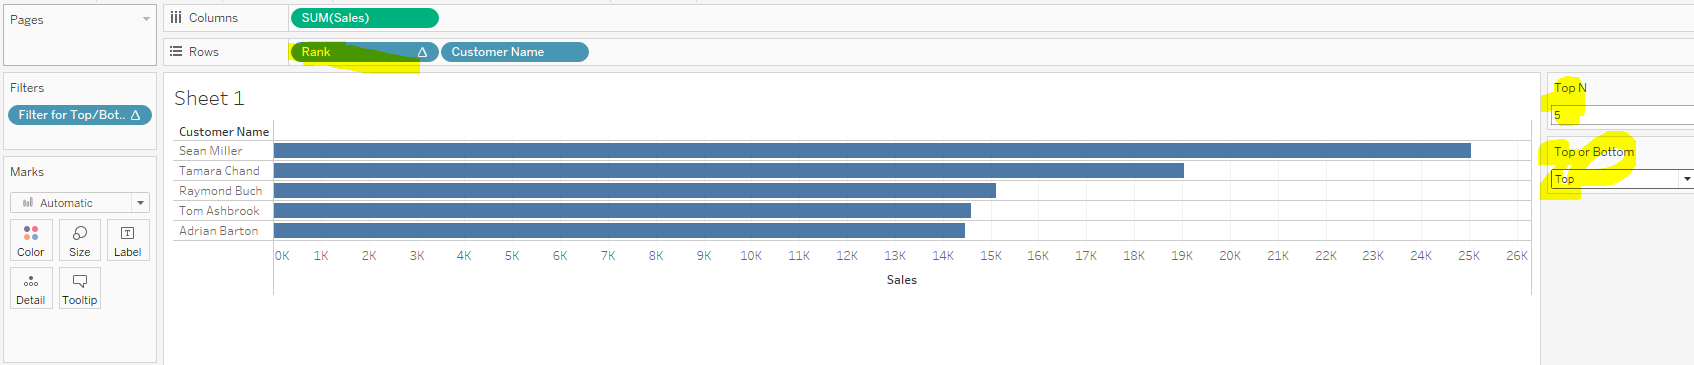
Now you will be able to update the chart using the parameters: