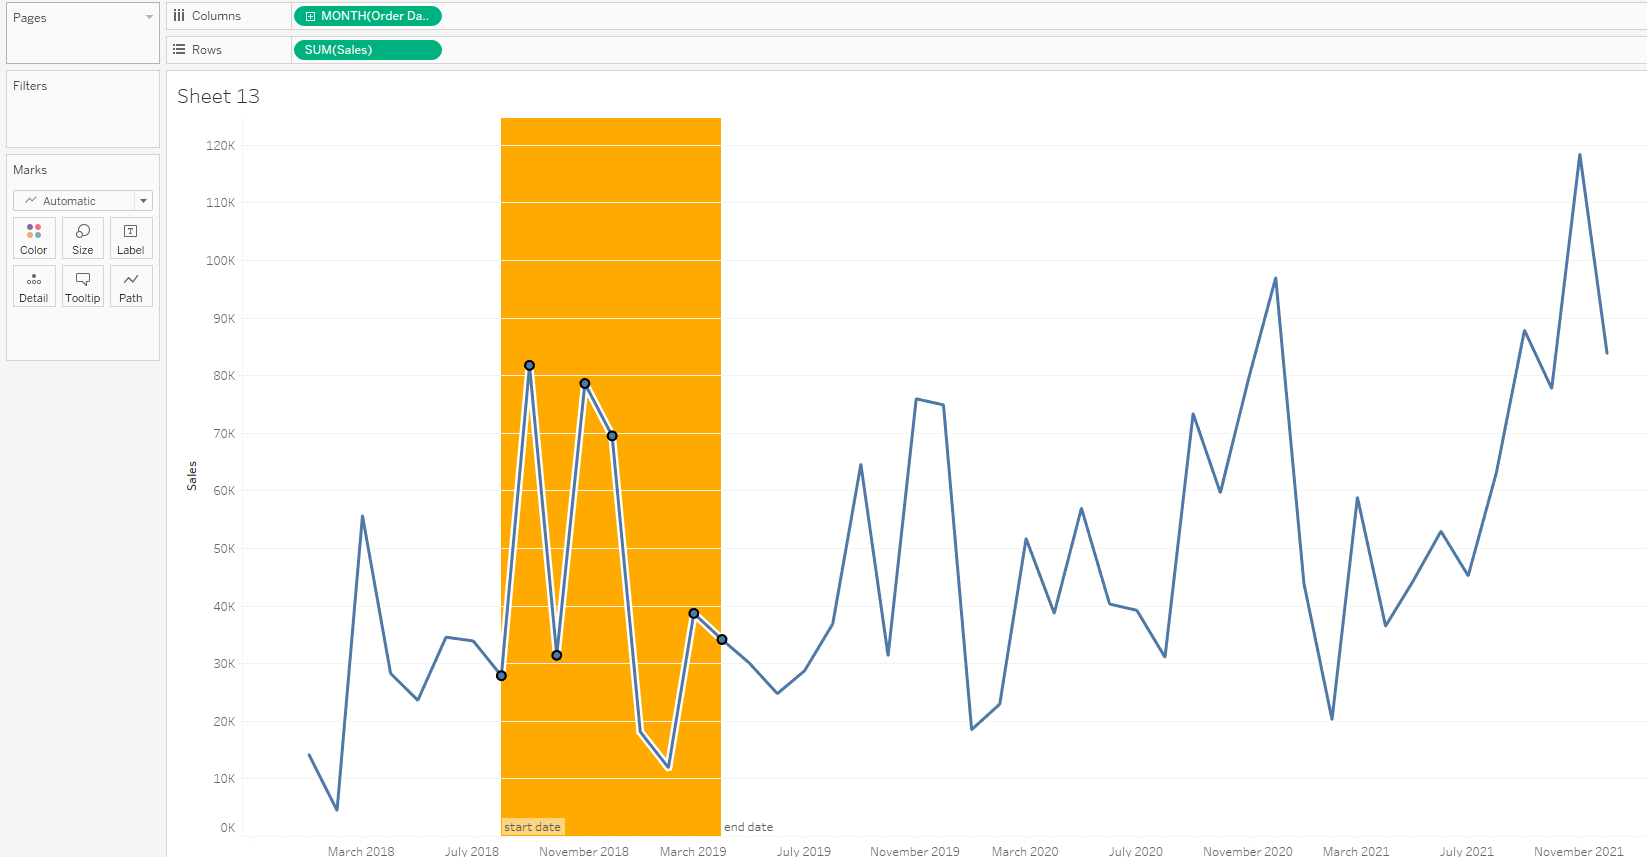
Finished Graph:
In this example we will use the Sample - Superstore dataset.
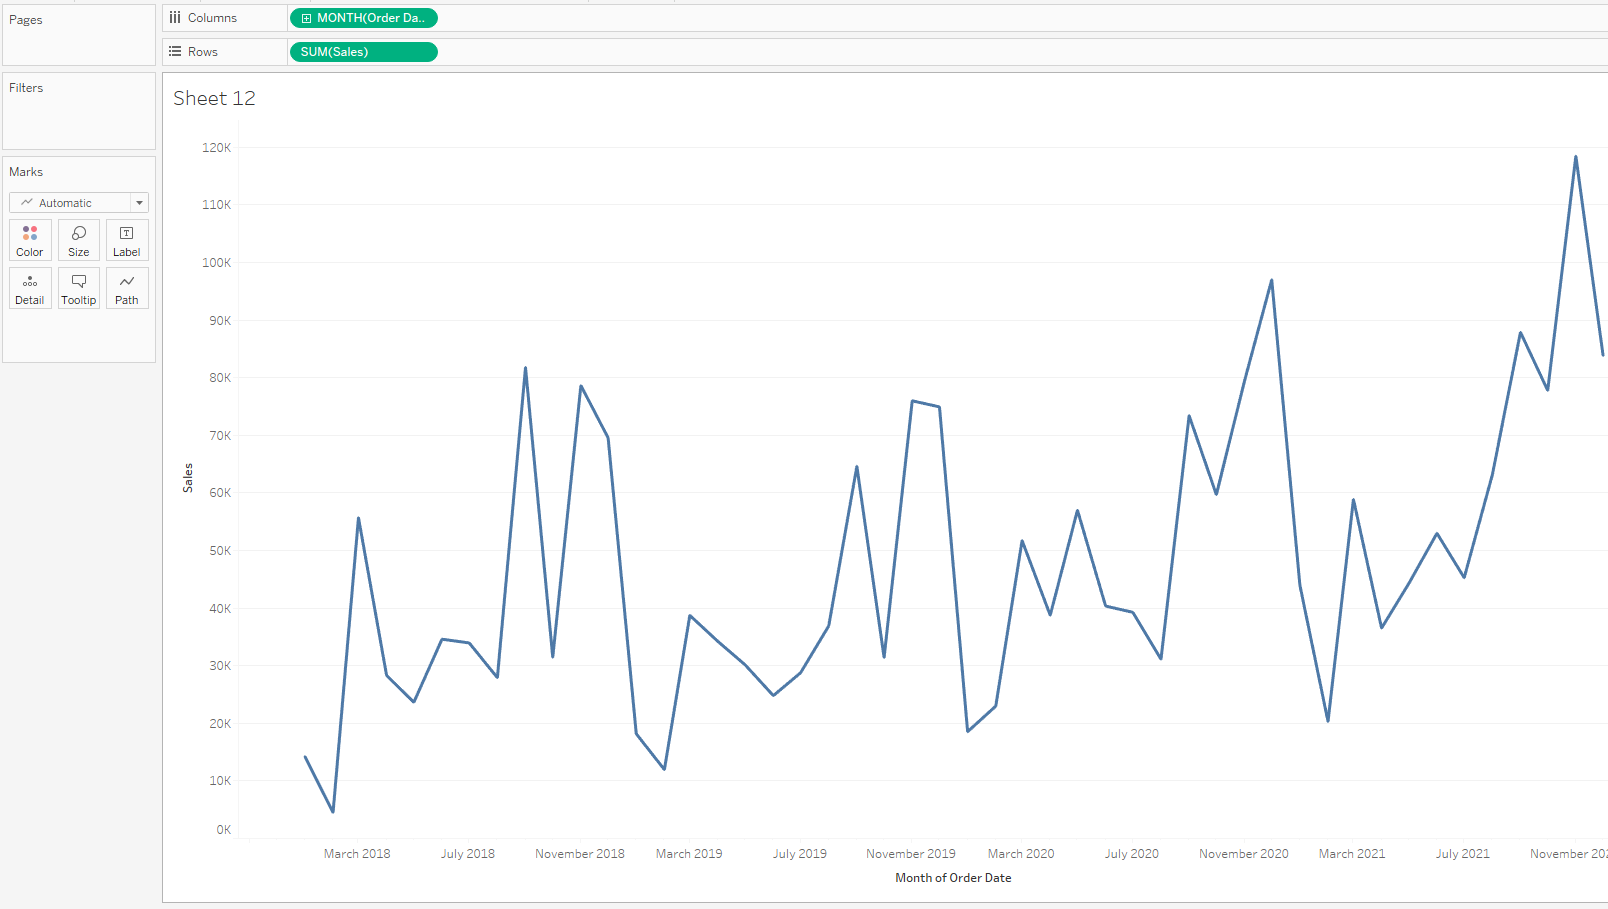
First we need to drag the SUM(Sales onto Rows and MONTH(Order Date) onto Columns:
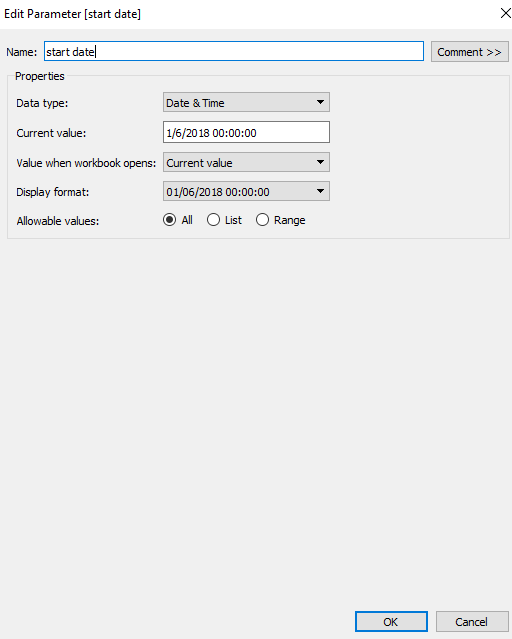
Then we need to create a 'start date' Date & Time Parameter:
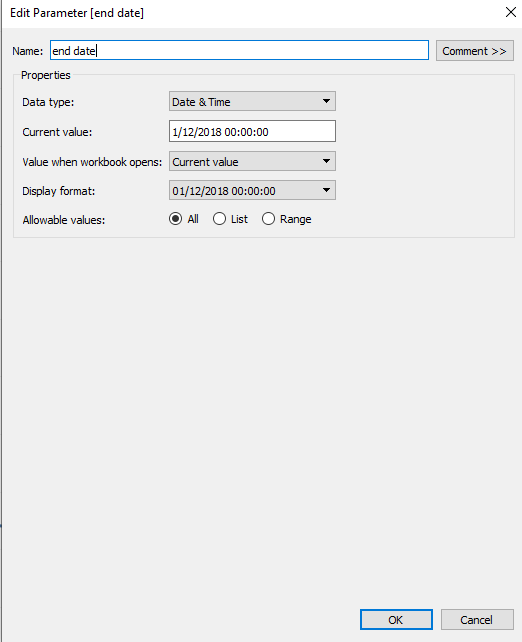
Then we need to create a 'end date' Date & Time Parameter:
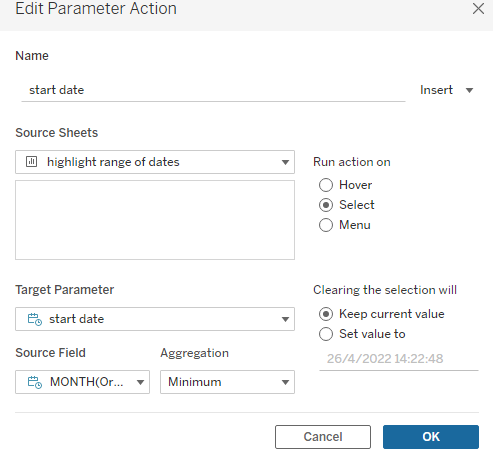
Now we need to create a Change Parameter action for this sheet under the Worksheet tab and call it 'start date', ensure the Aggregation is set to 'Minimum':
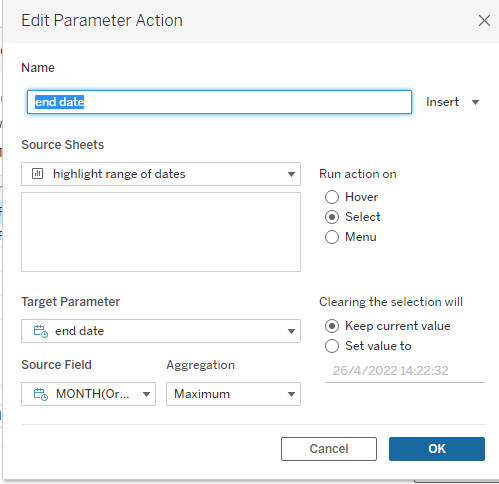
Now we need to create a Change Parameter action for this sheet under the Worksheet tab and call it 'end date', ensure the Aggregation is set to 'Maximum':
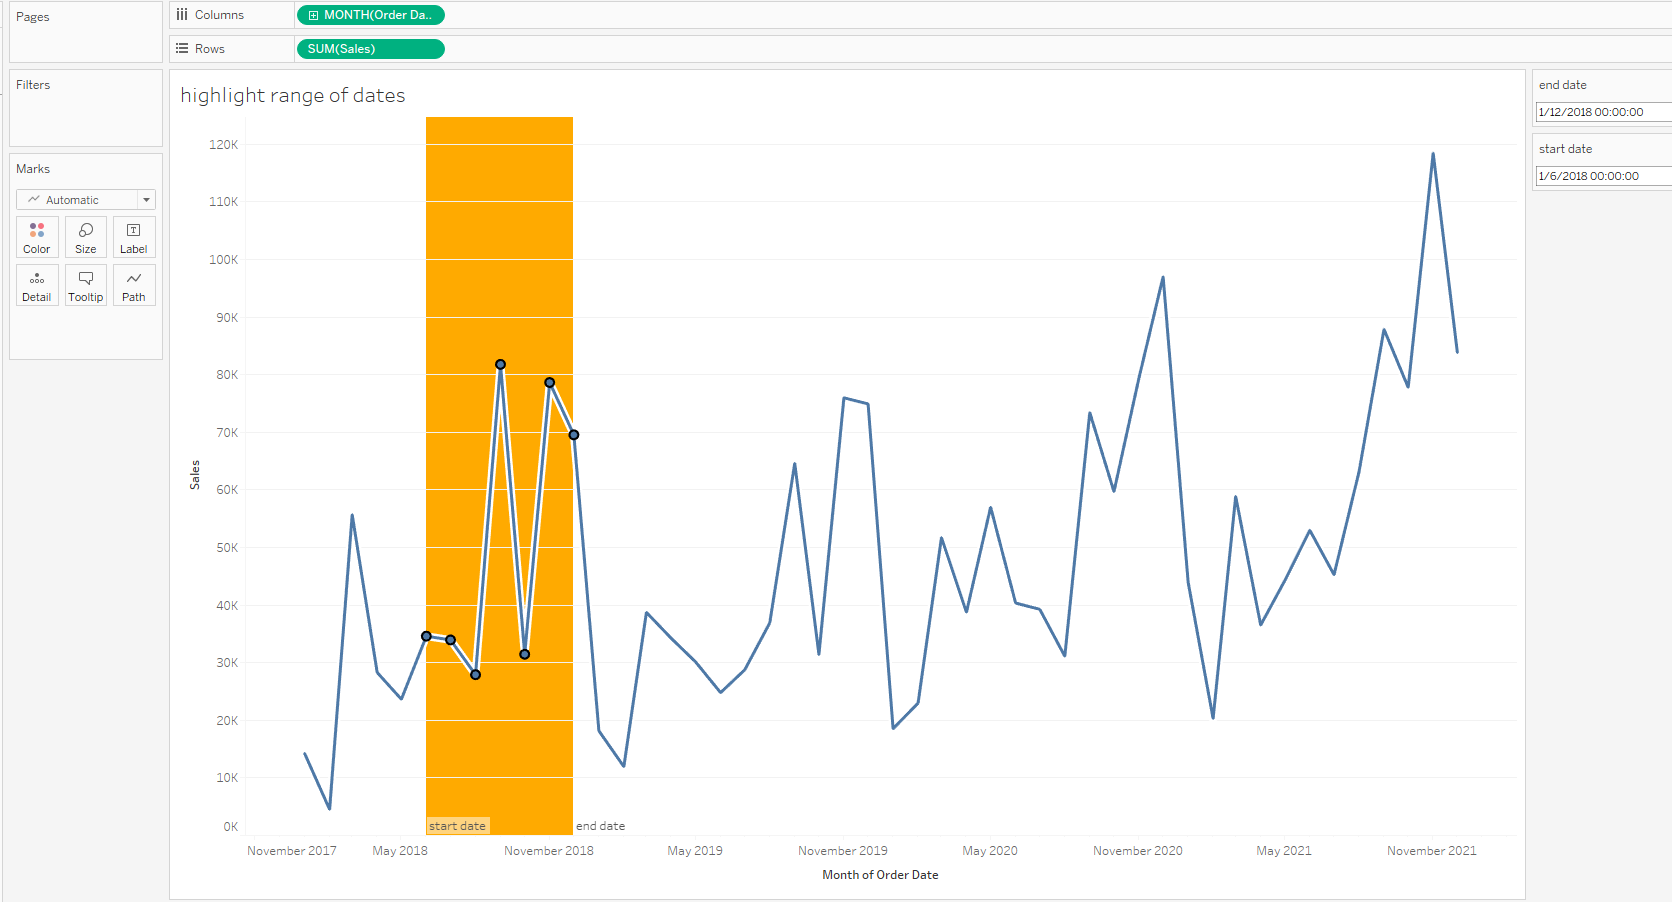
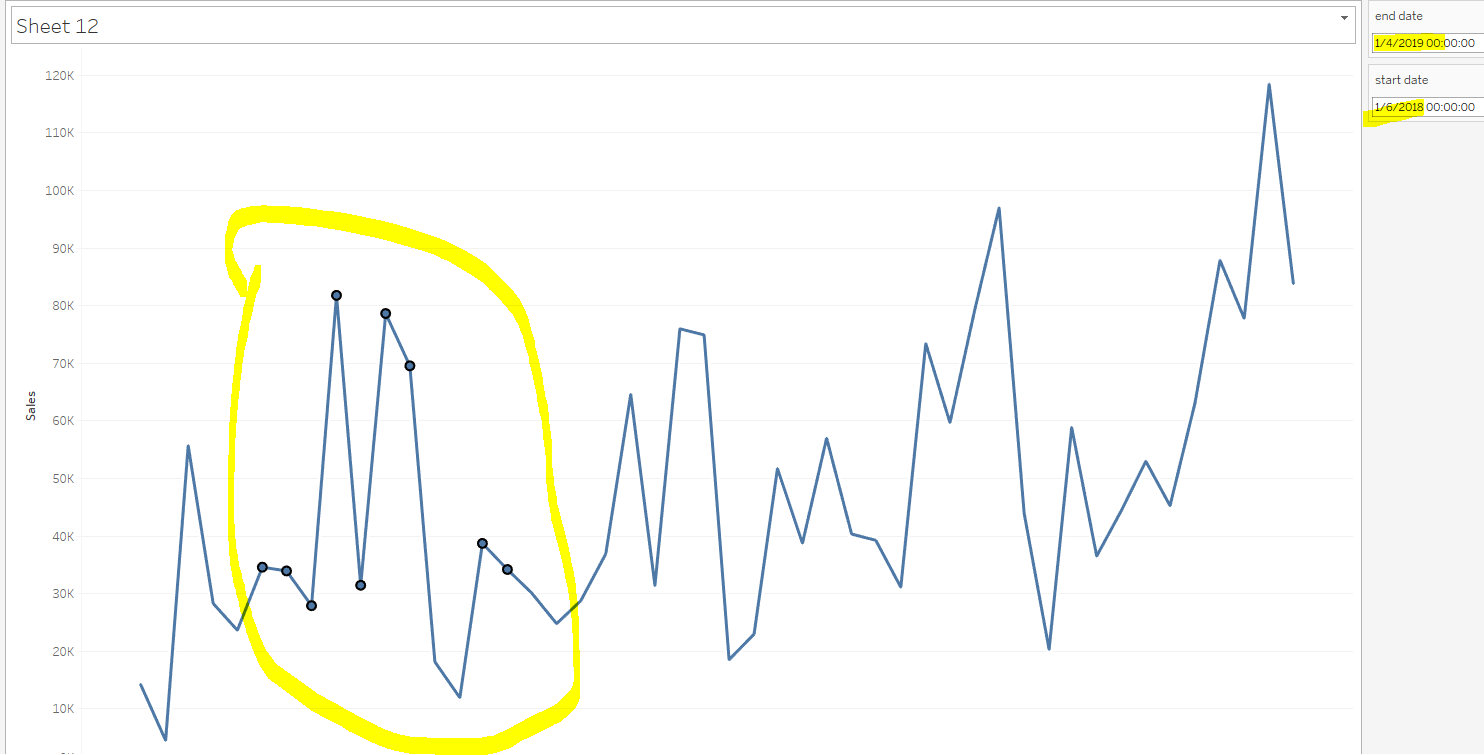
Right click and select the 'start date' and 'end date' Parameters to 'Show Parameter'. Now as we select a range of dates we can see our 'start date' and 'end date' update:
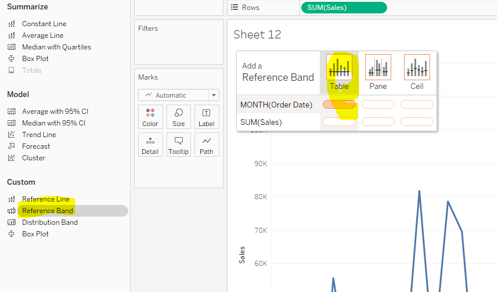
Under the Analytics tab, drag a 'Reference Band' onto the Table MONTH(Order Date):
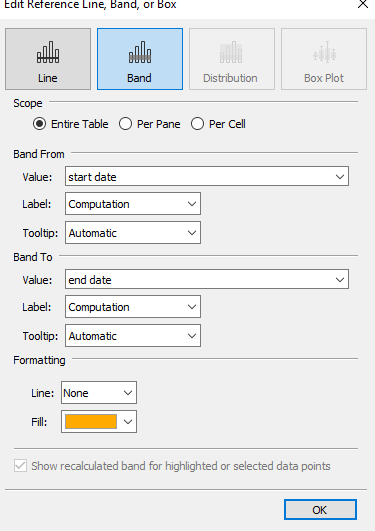
Update the 'Band From' Value to be 'start date' and the 'Band To' Value to be 'end date'. Change the fill color to your preference:
Now we can see our selected range updating to orange:
