


Brief
Analysing data about UK Street Crimes between July 2024 and July 2025 (select the relevant time frame here and download crime data and crime outcomes)
Use the data to build an Alteryx App that allows the user to pick a specific date range, category and area (using a map interface tool) or postcode to update a datasource onto our tableau server/your Power BI workspace (or tableau public using google sheets) to feed into a Tableau or Power BI dashboard.
Use case scenario:
- User runs the app
- Selects area of interest and timeframe
- Viz updates accordingly

Alteryx Chained App Part 1
Today's challenge involved a very large dataset split across several folders and .csv files. Instinctively, I wanted to union the data and then prep the data to filter down into smaller chunks. However, this would result in slowing down the whole workflow. Instead I chose to use a directory tool to select the .csv files.
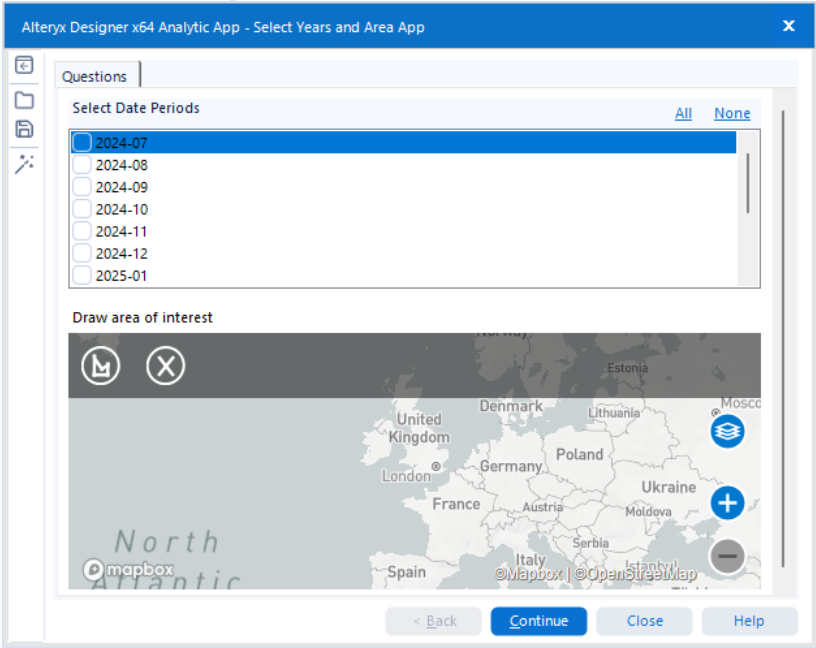
As the files names were year month followed by police force I added a date field by parsing out the month year. Using a summarise and crosstab this would would provide a list of dates that the user can select in the first interface option of the Alteryx app.
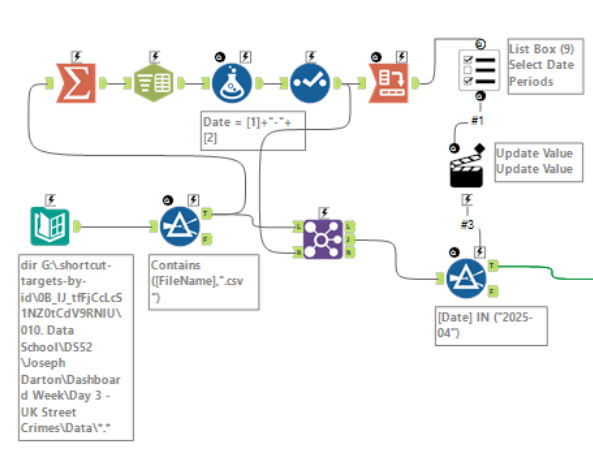
With the list box providing the available dates present in the dataset the user is able to filter to the required files drastically reducing the amount of data that needs to be loaded into Alteryx. However, a date interface tool could have been used for a more user friendly experience but I decided against this in case the user selects dates that are not present in the dataset.
Currently the dataset is a list of file path names of our .csv files. To extract the data from these files a dynamic input tool is used. Based on a provided input template and the field with the file paths, this tool is able to read the data in the .csv files and union them all together into a single dataset.
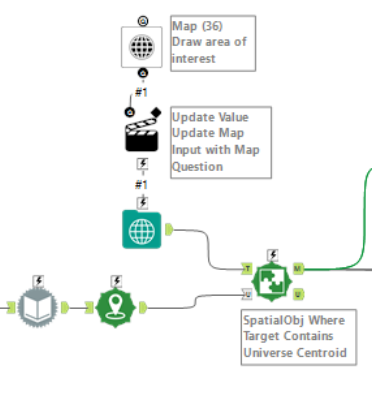
Next we want to give the user the option to narrow down to a specific area within the UK. This is done using a map input tool, which is set to a polygon encompassing the UK, and a map interface tool. The interface version of the map tool allows the user to change the point, line or polygon present in the map input tool.
Within the dataset, we have latitude and longitude values which we can make into points. Doing so will allow us to use a spatial match tool to check if the points in our dataset fall within the user-selected area on the map. If they do they are passed through to the final part of this workflow.
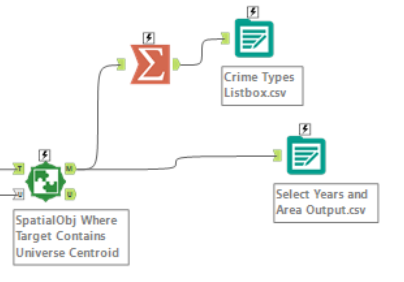
In this last part, the crime types that apply to the dataset filtered down by dates and area are summarised as a list to be inputted into another list box in the next Alteryx app. The dataset here is outputted to then be used as an input in the next app in our chain.
Alteryx Chained App Part 2
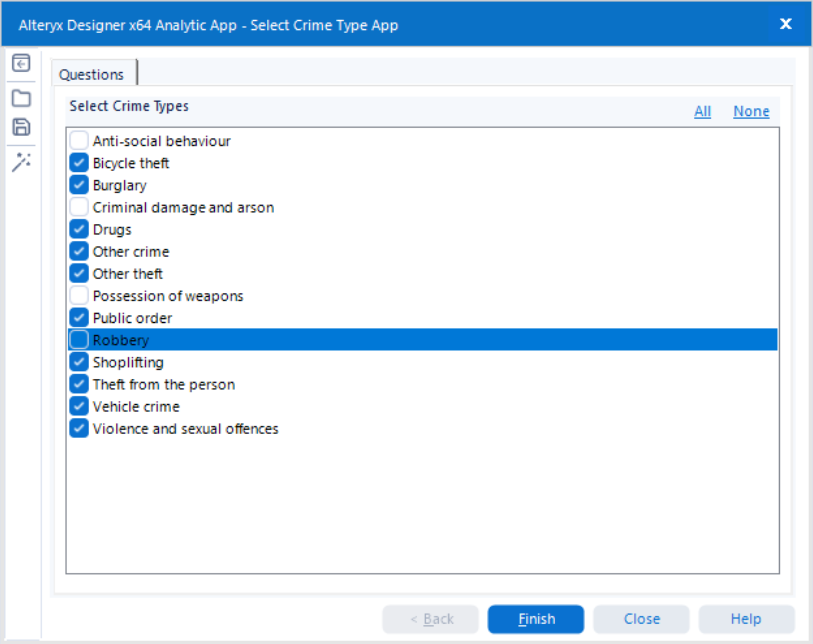
The following app is a lot more simpler than the first one as there is only one last user interaction required and that is selecting the category. For this use case I have decided to base that on the type of crime committed. Our final output is then exported as an Excel sheet.
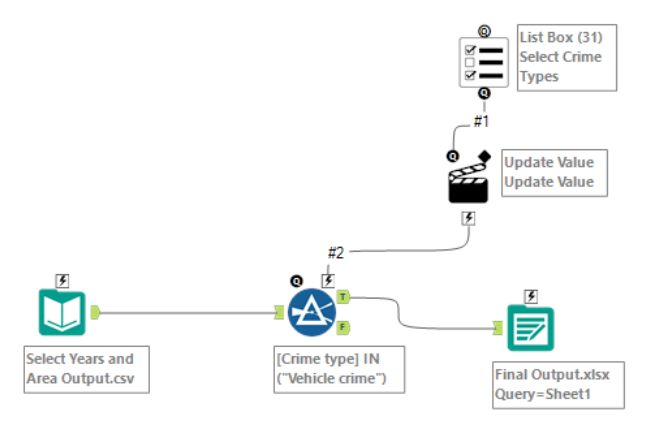
Using the options within the app interface will now update the Excel sheet which is connected to our Tableau workbook through a live connection.
Part of the brief mentioned using Tableau server and I saw this as an opportunity to try and store the filtered dataset as a data source on the server. In trying to do so, I ended up replacing my data connection with one published to the server which could no longer be updated. Unfortunately, this was not fixed in time for the presentation and provided a valuable lesson in having backups and allowing more time for testing.