


Plotting Points and Lines
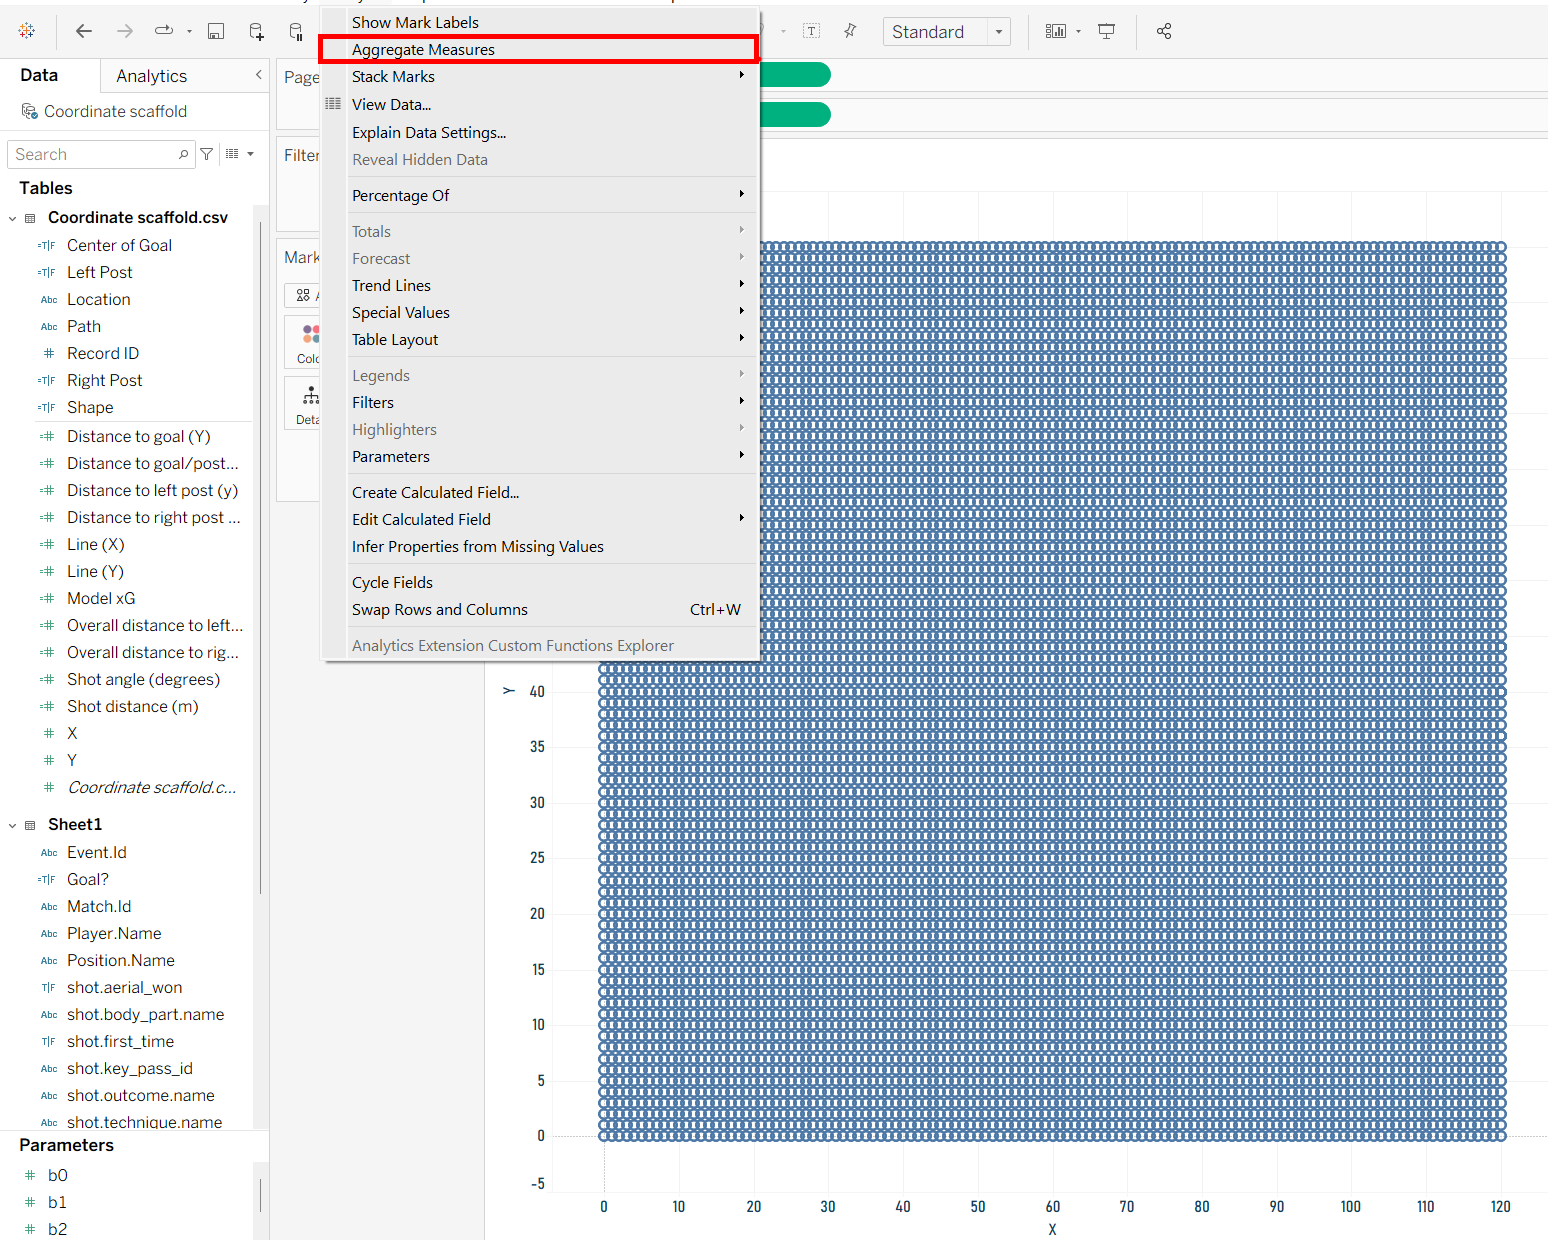
Now that we have the data it's time to start plotting our coordinates in Tableau using the pitch diagram provided by StatsBomb. To start we are going to put our X field onto the column shelf and our Y field onto the row shelf. After doing so make sure to go onto the analysis tab and unselect the aggregate measures option and you will get a grid of marks.
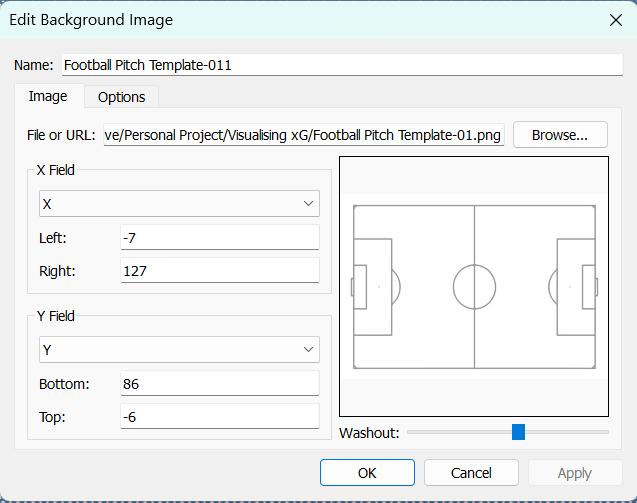
Next, we want to plot these points onto a background map of a pitch. Select the map tab and click on background images to add your pitch diagram. The exact bounds may vary depending on if your image has some sort of border around it but if basing it off the StatsBomb diagram they should be around the same values as shown below.
Feel free to customise your marks as you see fit but I have opted to make them transparent and small enough to just fill the penalty spot. We will now create a parameter and an accompanying action so the user is able to select a point which will be used to run an xG calculation and draw some lines towards the goal. To do so, right click on your unique identifier for each point (such as record ID) and select create then parameter.
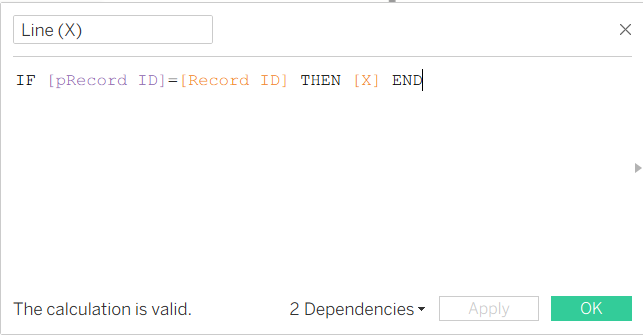
We can now create our lines that will only appear for the point the user has selected. Create calculated fields using the X and Y fields to only return the data associated with the selected point.
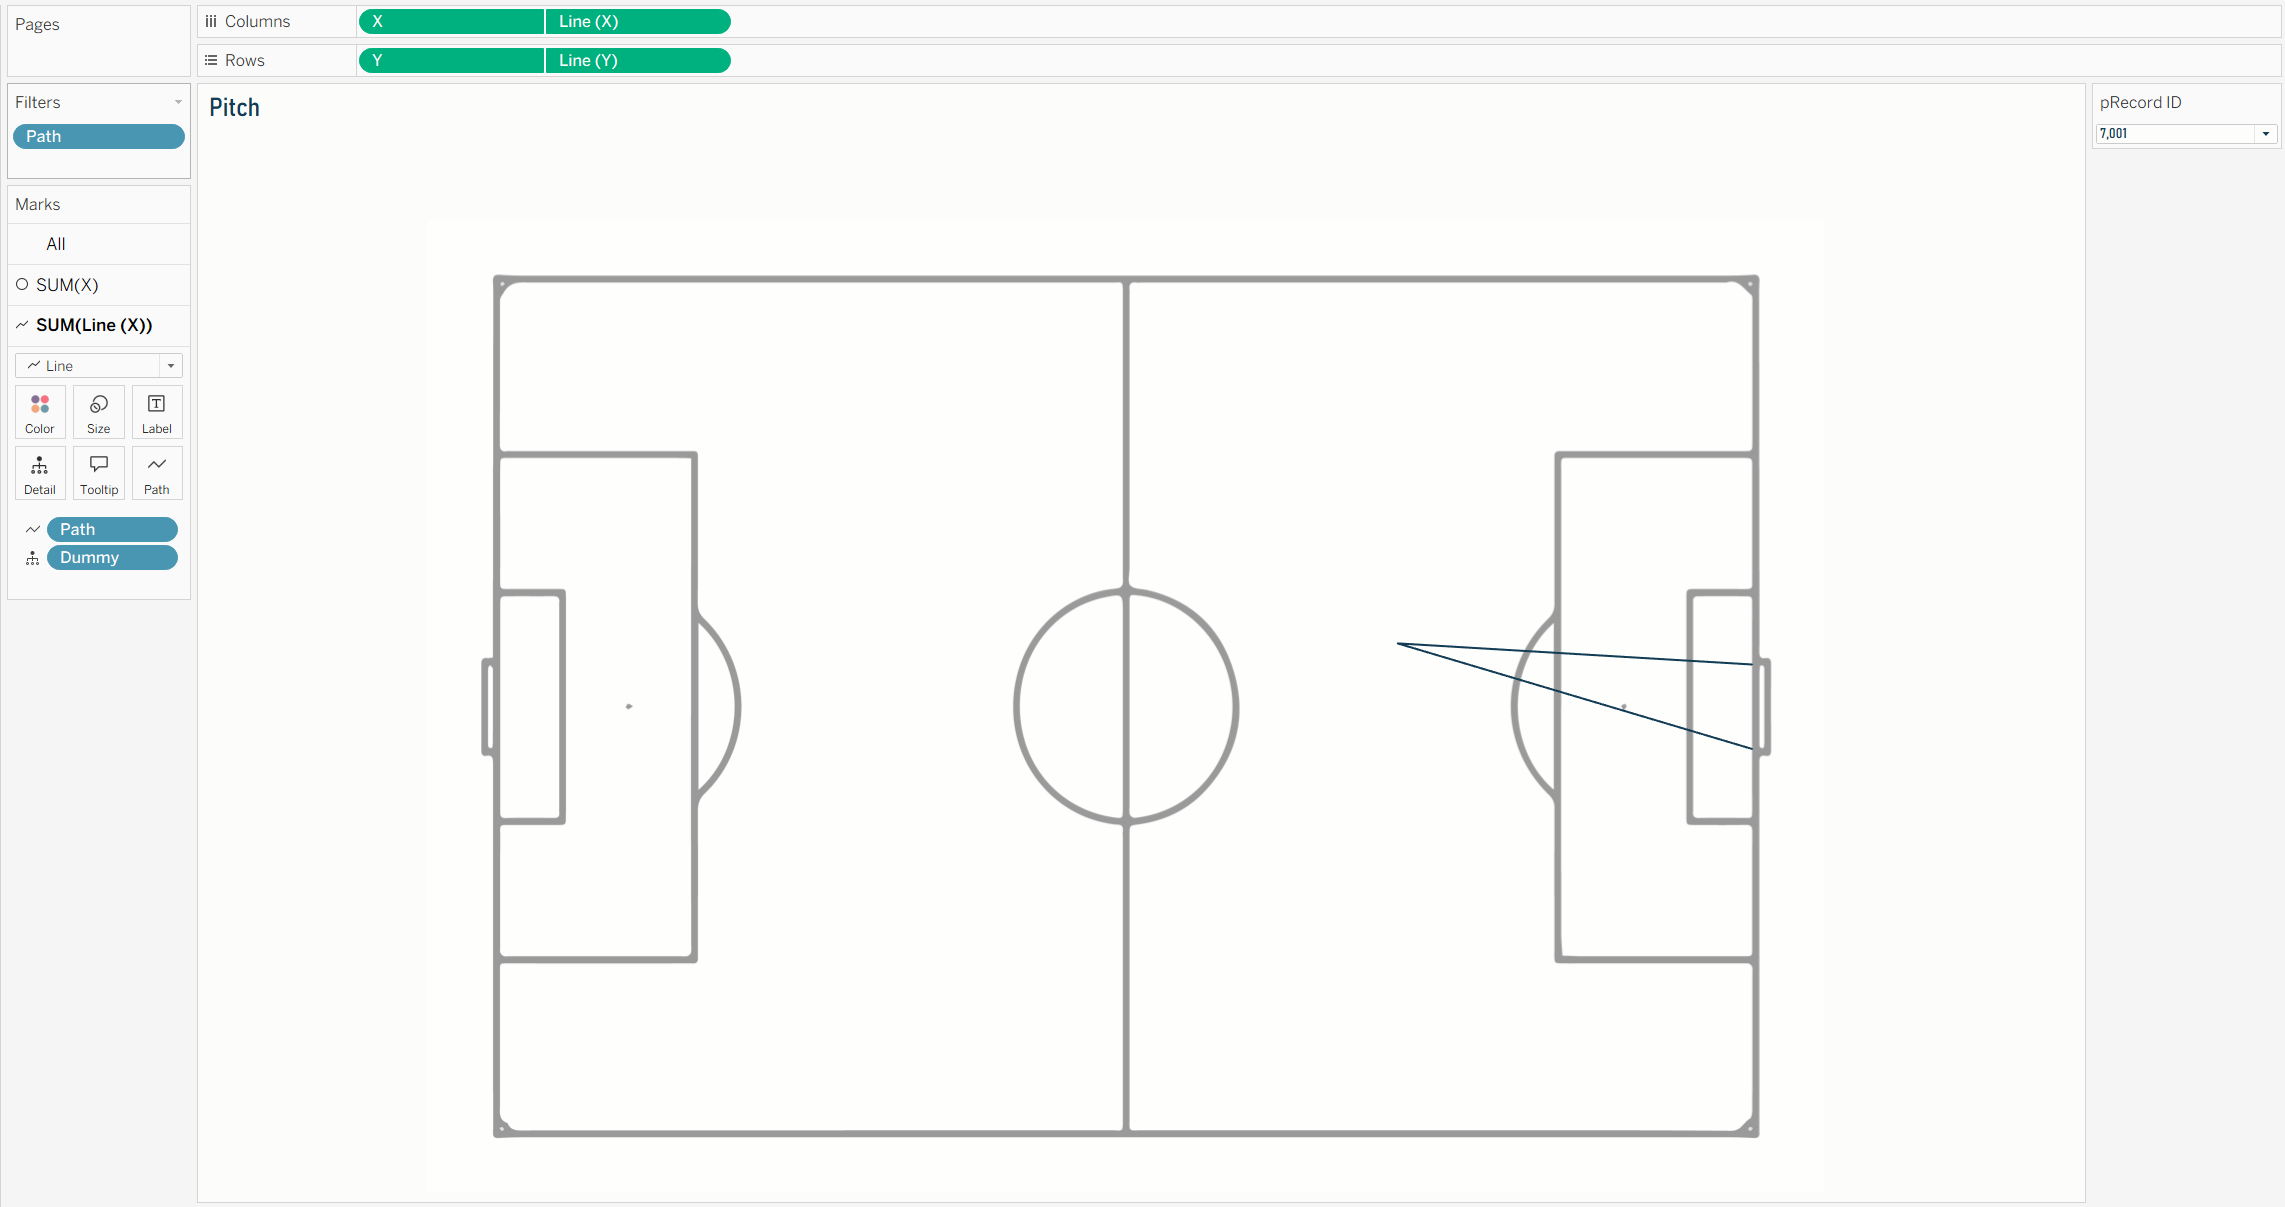
Then drag these two new fields next to their corresponding original fields on the column and row shelfs and turn them into dual axes. We now have a second mark that we can turn into a line and drag path onto the path card. This will now draw lines from the point to the left and right post of the goal (I decided to filter out the line from the point to the middle of the goal).
Geometry
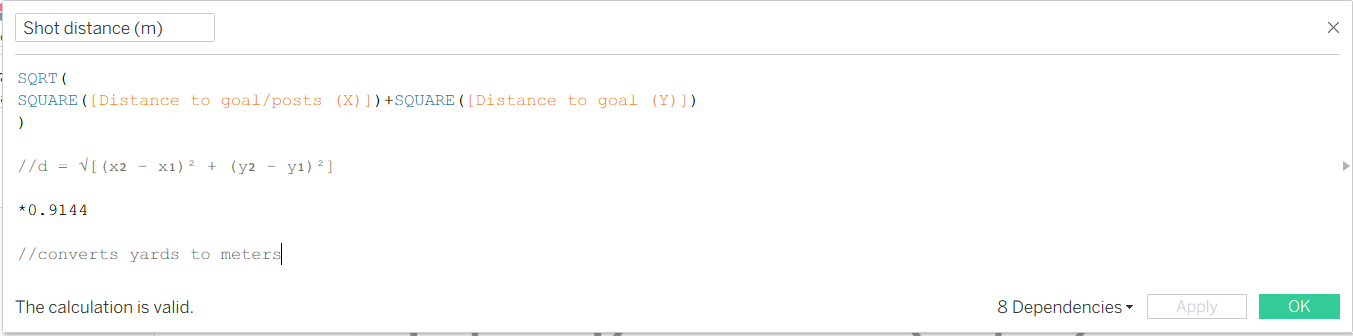
With that out of the way, we need to use trigonometry and Pythagorean theorem to calculate our distances and angles between our points. Our model will be using distance in metres while our coordinates based on yards so distances will need to be converted. With d as our shot distance we need to replicate the following formula in Tableau:
To break this down and make it easier to read I have the x2-x1 and y2-y1 calculated as separate calculations. This would be the difference between the point and the goal for the x and y values respectively (120-[x] and 40-[y]). Our overall distance to the goal would then be calculated in Tableau as below:
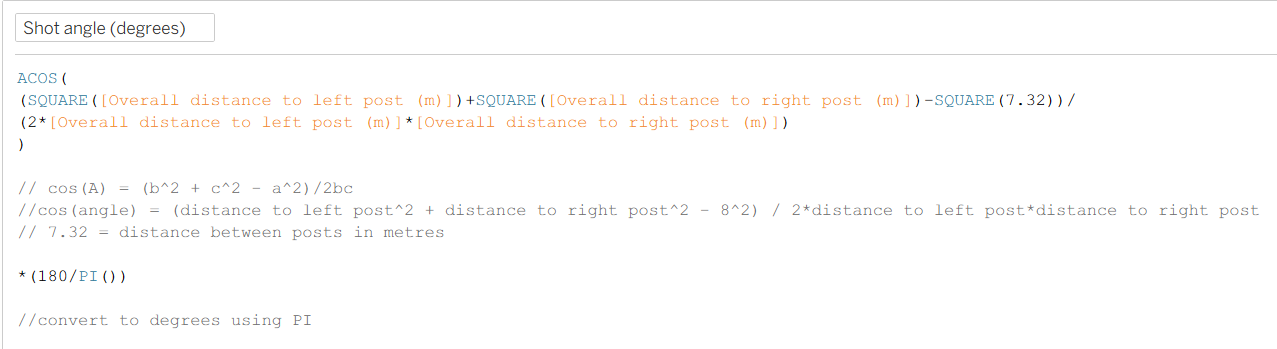
To calculate our angle we will need to use a variation of the cosine rule as shown below:
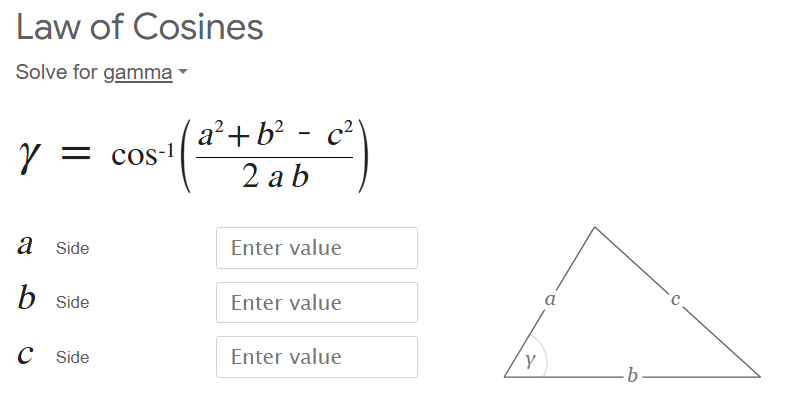
In this situation side a would be the distance to the left post, b would be distance to the right post and c would be the distance between the posts. The distances to the post are calculated with the same logic for our calculation of the shot distance and the distance between is simply 7.32 metres. Our final calculation then looks like this:
We now have our two main parameters used in our model to calculate xG dynamically based on user selection.