


Today, my brief was to prepare a dashboard in Tableau that could be accessed by a user with accessibility requirements regarding the keyboard, outlined below.
Brief
Scenario: Access London has hired an expert in accessible urban design to assess how inclusive the city's top attractions and transport links really are. They have a visual impairment and rely solely on keyboard navigation with screen magnification.
🎯 Key Requirement:
Efficient keyboard-only navigation across filters, tooltips, and pages — no mouse dependency.
We had a session with Louisa in the morning, leaving me with 4.5 hours to create this dashboard. Timings are as follows:
Timeline
11:00 - 12:00 - Research, plan, understand brief and data discovery/dictionary (if necessary)
12:00 - 13:00 - Sketch out dashboard with accessibility requirements thought out
13:00 - 15:00 - Build the dashboard testing and iterating upon accessibility requirements.
15:00 - 15:30 - Test accessibility and plan presentation
Initial thoughts
The user will be used to navigating with common keyboard shortcuts - so I need to learn these and list them here to understand how this user would interact with their computer:
Tableau interactions (general):
| Action | Windows Keystroke | macOS Keystroke | Description |
| Move Focus Forward | Tab | Tab | Moves focus to the next interactive element (filters, buttons, views, etc.) based on the defined Tab Order. |
| Move Focus Backward | Shift + Tab | Shift + Tab | Moves focus to the previous interactive element. |
| Activate/Select | Enter or Spacebar | Return or Spacebar | Activates the focused element, such as: * Clicking a button * Selecting an item in a list filter * Opening a dropdown menu |
| Clear Selection / Exit | Esc (Escape) | Esc (Escape) | Clears a mark selection on a visualization or exits a pop-up menu/dropdown control. |
Tableau interactions (filters and controls)
| Control Type | Action | Keystroke | Description |
| List/Legend Items | Move between items | Arrow Keys (Up/Down/Left/Right) | Navigates between individual values in a list filter (Single or Multiple Value List) or items in a legend. |
| Select/Deselect Item | Toggle Selection | Spacebar | Toggles the selection of the currently focused item in a Multiple Value List filter or Legend. |
| Dropdown Filter | Open Menu | Enter or Spacebar | Opens the dropdown menu. |
| Dropdown Filter | Move in Menu | Arrow Keys (Up/Down) | Navigates between the options within the open dropdown. |
| Dropdown Filter | Apply Selection | Enter | Selects the focused item and typically applies the filter/parameter change. |
| Parameter/Range Slider | Increment/Decrement Value | Arrow Keys (Up/Down/Left/Right) | Increments or decrements the value in a supported parameter or range slider. |
Tableau interactions (Views)
| Action | Windows Keystroke | macOS Keystroke | Description |
| Activate Viz for Marks | Enter or Spacebar | Return or Spacebar | Activates the visualization for inner navigation (often used with screen readers). |
| Navigate Marks | Arrow Keys | Arrow Keys | Once the viz is active, this can be used (especially with text tables or certain specialized vizzes) to move focus between headers or columns. |
| Open View Data | Shift + Enter | Shift + Return | Opens the View Data window for the visualization that currently has focus. |
Hotkeys for presentation
| Action | Windows Keystroke | macOS Keystroke | Description |
| Presentation Mode | F7 or Ctrl + H | Option + Return | Enters/exits Presentation Mode (full screen). |
| Full Screen | F11 | Control + Command + F | Toggles the browser's full-screen mode (depends on the browser). |
| Refresh Data | F5 | Command + R | Refreshes the view/data source (depending on the environment). |
I then went to look for hotkeys for windows navigation more generally:
| Action | Keystroke | Description |
| Move Focus Forward | Tab | Moves focus to the next interactive element, button, link, or input field. |
| Move Focus Backward | Shift + Tab | Reverses the direction of the Tab key. |
| Select/Activate | Enter or Spacebar | Executes a command, selects a focused item (checkbox, radio button, button), or follows a link. |
| Exit/Escape | Esc (Escape) | Closes most menus, dialog boxes, or cancels an operation. |
| Open Context Menu | Shift + F10 or Menu Key | Opens the right-click menu for the focused item (file, text, button, etc.). |
I also looked into Tableau Public for inspiration:


Design notes:
- Logical tab order - this is key
- Place filters together at the top of the screen, organised left to right
- Radio buttons work well, avoid range sliders
- Use sets and parameters to filter but not clickable actions as these aren't accessible for keyboard-only users
- Potentially, customise the tab-order of the dashboard if auto-generated isn't feasible.
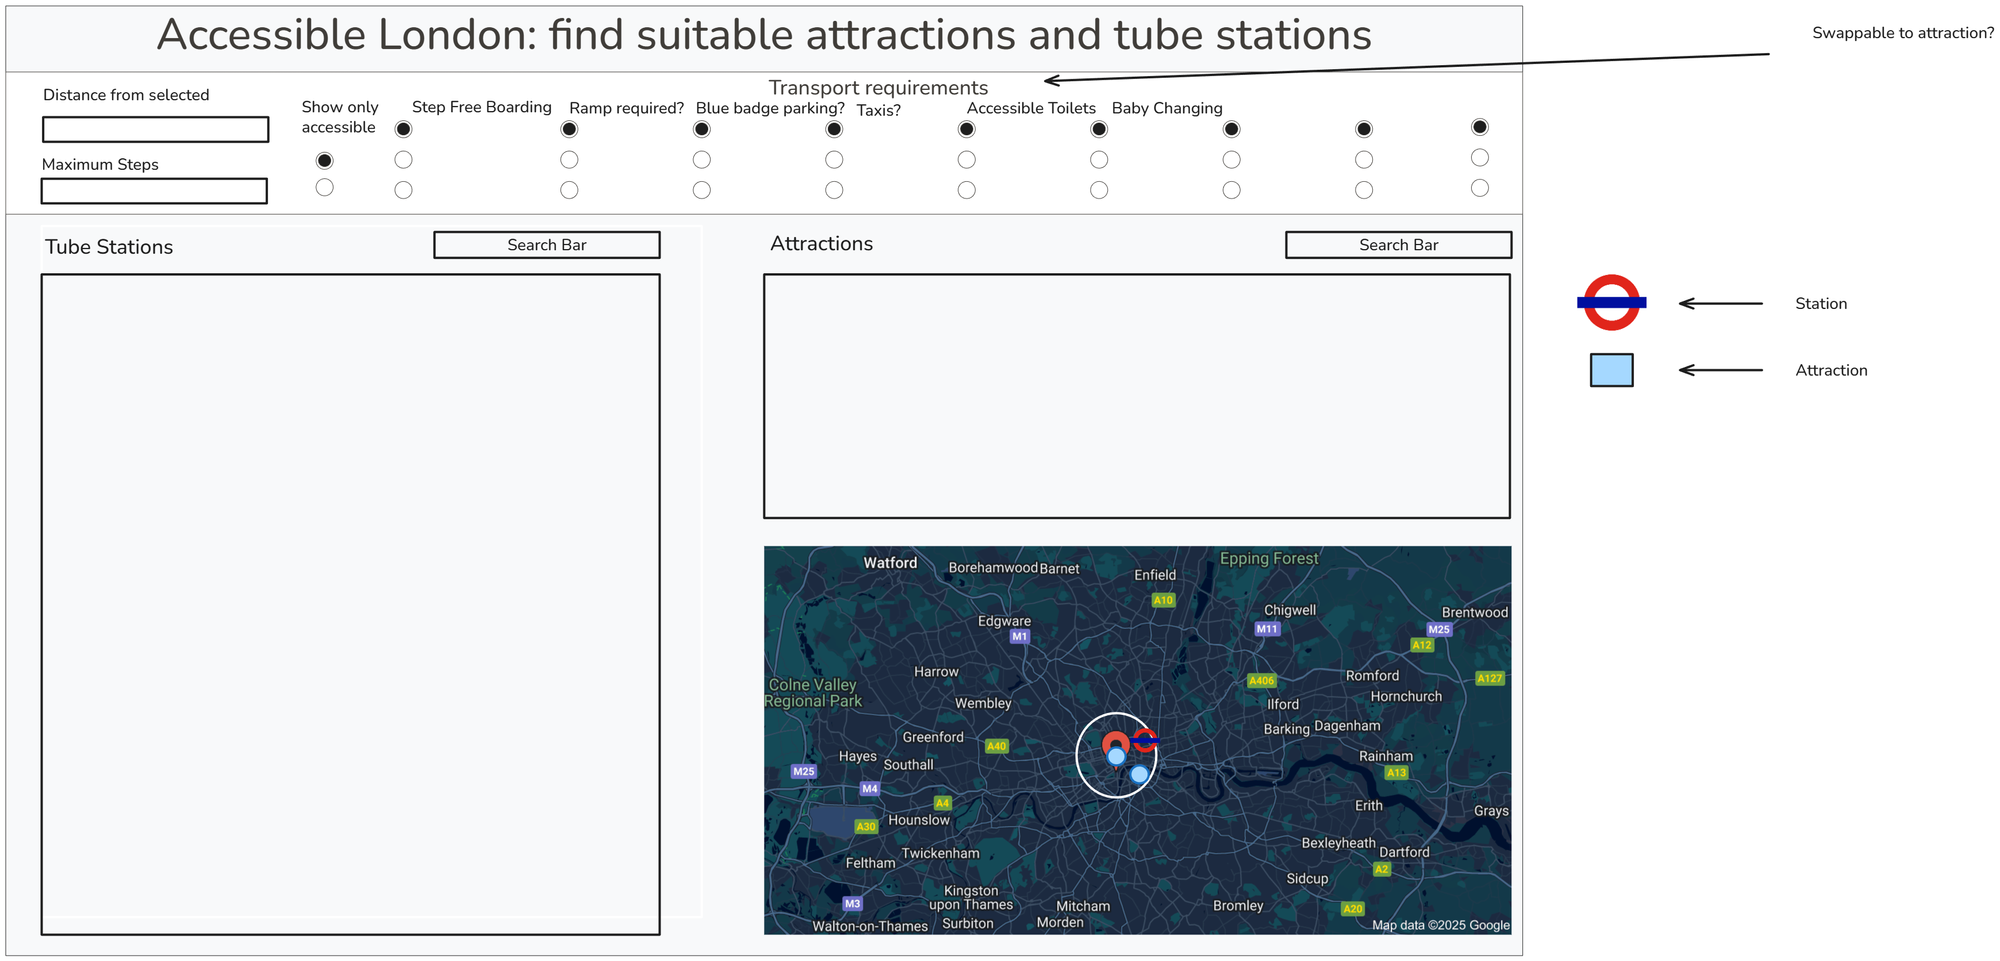
Now its time to sketch and plan out my dashboard (after a peek at the data). Making sure to layout a top control panel and not hide any information behind clickable actions.
Sketch:
When it came to the data, I had two datasets which could be joined on their spatial information in Tableau. This was achieved using a spatial join, as you cannot relate tables based upon spatial data.
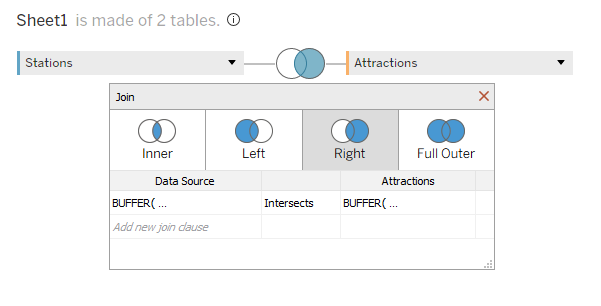
Based on the calculations:
BUFFER( MAKEPOINT([Station Lat],[Station Long]),5,'km')
INTERSECTS
BUFFER( MAKEPOINT([Latitude],[Longitude]),5,'km')
This means that each station within a 10 km radius of an attraction will be joined to the data and can therefore be visualised.
Here is the result!
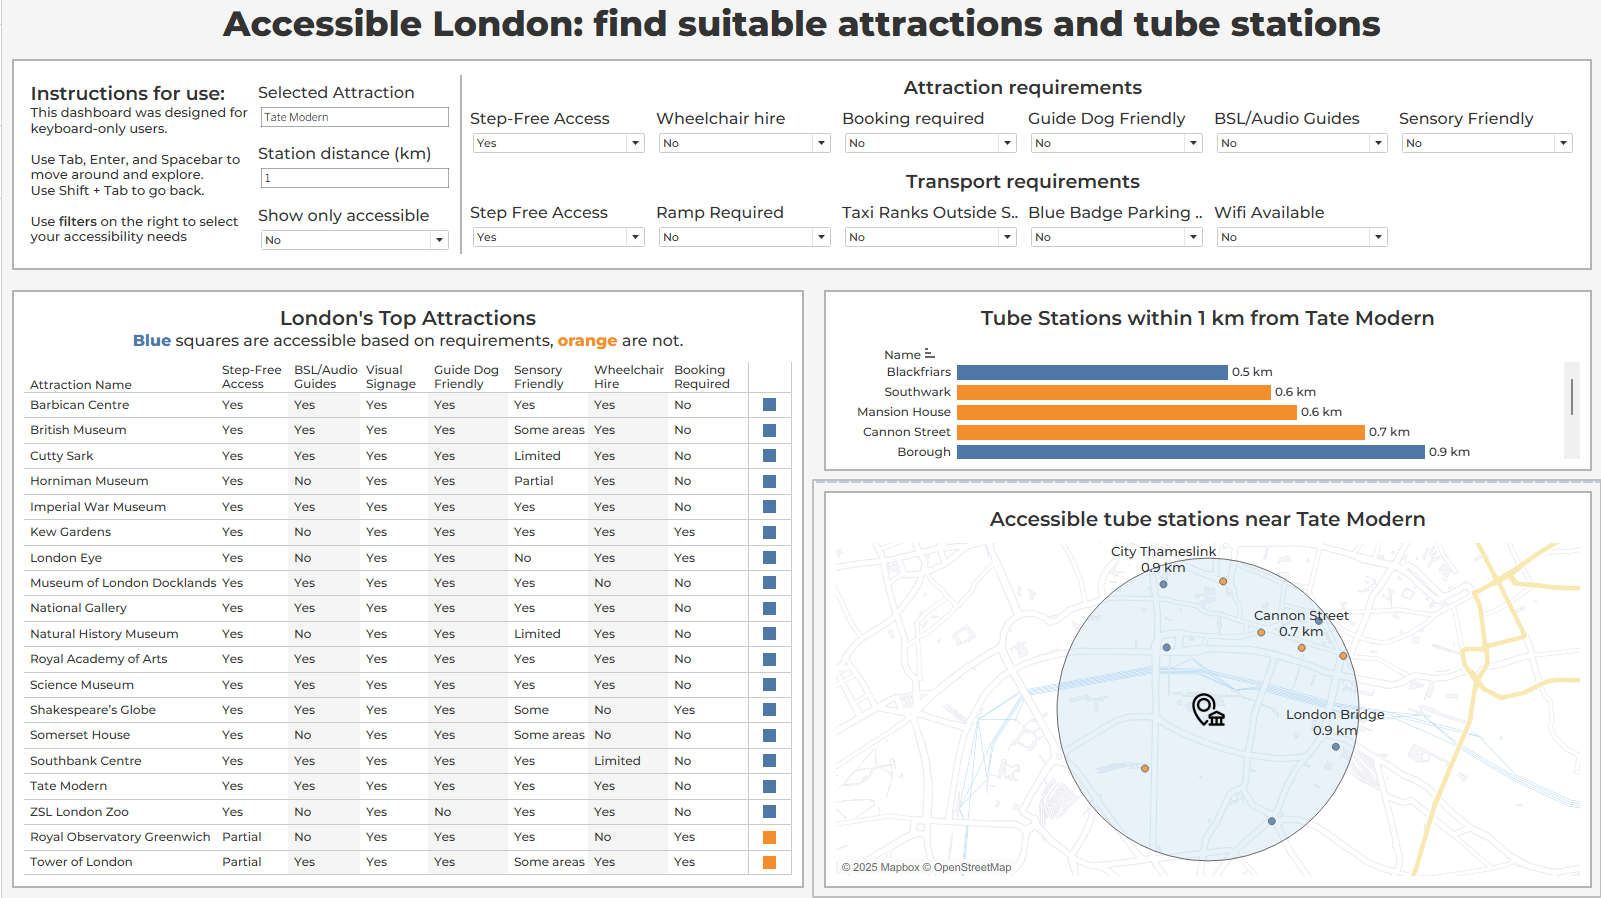
View it here on Tableau Public and have a go at interacting with it - https://public.tableau.com/app/profile/joss.lazenby/viz/Accessibility_17640760614330/ActualDashboard#1