


It's time for dashboard week! If you're unfamiliar, here are the rules for myself and my cohort throughout this week:
- They must work independently, unless otherwise specified.
- If data prep is required, they can use Alteryx, Tableau Prep, SQL or Power Query, unless otherwise specified.
- They must create a sketch of their plan for their dashboard and show this during their presentation.
- The dashboard they create must be uploaded to Tableau Public or Power BI Service (and embed it into their blog). If no visualisation tool is specified in the challenge, they can choose themselves.
- They must write a blog post detailing their work throughout the day.
- At 3:30 pm, they will present their data prep, sketch, viz, and anything else they would like to present.
The brief for today is to create a visual CV using PowerBI, following these requirements:
- Create my own CV dataset
- Build a visual CV in Power BI
- Publish to Power BI Service
- Make sure to follow the rules as above
- Submit your entry in the contests gallery
- Presentations will be at 3:30pm
As such, I started by combing through examples of visual CV's I found online, such as these:
- https://public.tableau.com/app/discover/resumes:
- https://public.tableau.com/app/profile/adedamola8122/viz/ResumeDashboard_3_18_25/ResumeDashboard
- https://public.tableau.com/app/profile/ann.jackson/viz/AnnJacksonResume/AnnJacksonResume
- https://public.tableau.com/app/profile/lukas.jennings/viz/CV_16022456995430/CV


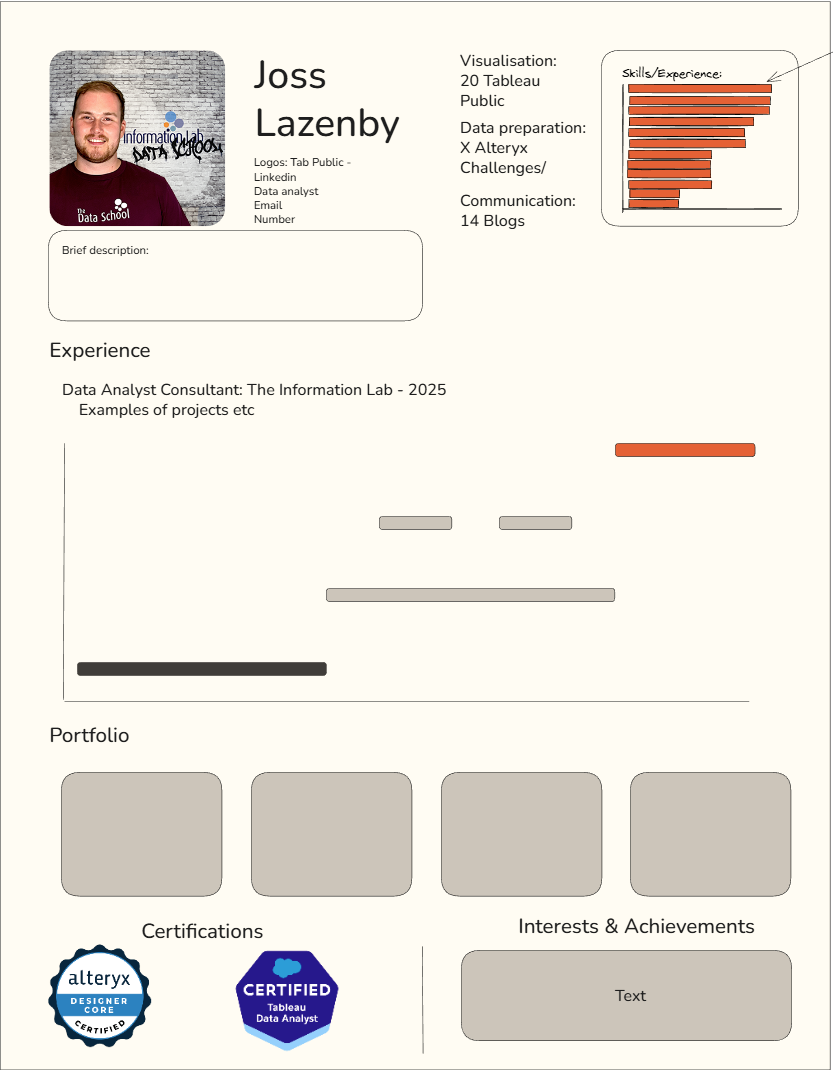
And then I began sketching out a rough first draft that would incorporate the following characteristics about myself:
- Title (Name)
- A picture (top left/right)
- Brief description
- Education - a static portion perhaps?
- Experience: all work after my degree - gantt bars with drilldowns?
- Skills (at-a-glance - top of screen) - this would be a cool one to do a radial chart for? Otherwise it could just be a bar chart (MVP)
- Tools & Certifications (very bottom portion) - this could just be images of the certs with links to where they live online
- Portfolio - links to dashboards made recently
These are the characteristics I'd like the dashboard to have:
- Portrait, can be printed (export to .pdf) like a traditional CV
- Visual - try to make it pop and wow an interviewer
- Concise - minimise the amount of text, have everything fit into a single page allowing for drilldowns/navigation buttons that can give further context if necessary
Here is my plan for the day (timings):
09:00 - 09:30 - Outline plan and requirements
09:30 - 10:30 - Sketch out a first draft (got some feedback from Robbin)
10:30 - 11:30 - build the dataset
11:30 - 15:15 - build the dashboard
15:30 - 17:00 - present work
Formatting guide:
Using this colour scheme: https://coolors.co/palette/fffcf2-ccc5b9-403d39-252422-eb5e28
- Main colour - Spicy paprika EB5E28
- Other marks - Silver CCC5B9
- Alt highlight - charcoal black 252422
- Background - Floral White FFFCF2
Sketch:
Dashboard!