


Often, Key Performance Indicators (KPIs) require additional context to be useful. Comparisons to other relevant dates is often a consideration that stakeholders request in dashboards. This blog will take you through creating a KPI that compares "Current Year to Date" and "Previous Year to Date".
This blog will use the Sample - Superstore dataset provided with Tableau (accessed 02/10/2025).
Step 1: Pick your metric
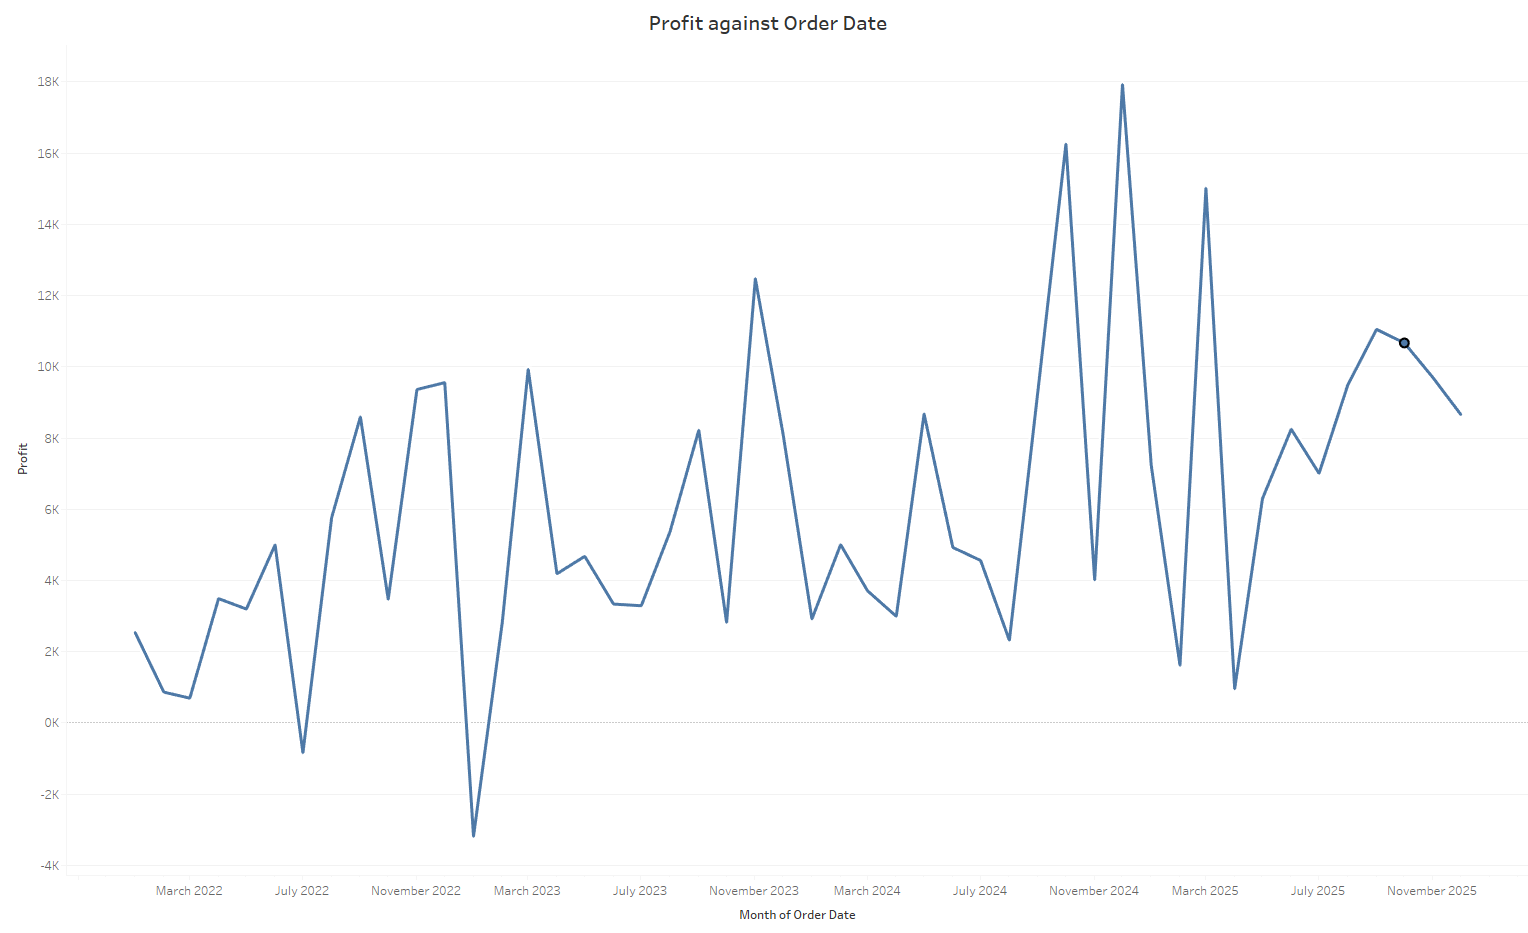
Within Superstore, we have several different measures we can choose from for KPIs. In this example, we will use SUM(Profit), as seen plotted against Order Date below.
Step 2: Calculate Profit to Date (Current Year)
This requires us to create a calculated field that returns profit for dates ranging from the start of the year to the current day. We can easily get today's date using the TODAY() function, if you'd rather have "Today" be a variable then you can also use a date parameter instead.
The rest of our function looks like this:
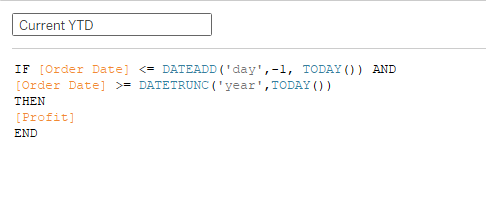
Let's break that down:
Our IF statement returns [Profit] if the conditions contained within are TRUE.
These are:
The [Order Date] is less than or equal to yesterday. We select yesterday as it was the last full day of sales. Yesterday is calculated by subtracting 1 from TODAY() by DATEADD().
The [Order Date] is greater than or equal to the start of the year. We calculate this by using DATETRUNC(). DATETRUNC aggregates a date based upon the date part given (such as 'day', 'month' or 'year') to the lowest possible value. In this case, it aggregates to 01/01/2025, which is the lowest possible value within the 'year' part of the date.
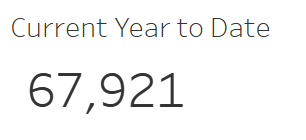
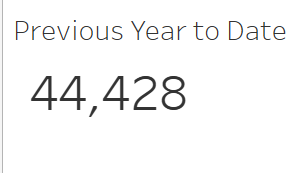
This gives us the our current year to date KPI.
Step 3: Calculate Profit to Date (Previous Year)
This is a second calculated field, similar to the first. Displayed below.
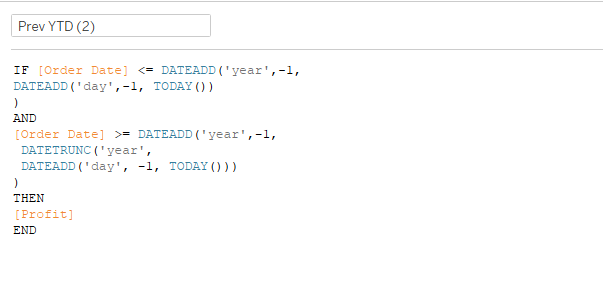
Whilst this calculation looks more complex than the first, the only change required is wrapping each clause from the right side of the logic statements with a DATEADD(). Similarly to how we subtracted a day from TODAY(), we now subtract a year from each of our dates.
This means:
IF the [Order Date] is less than or equal to yesterday last year AND the [Order Date] is greater than and equal to 01/01/2024 (or the start of this year minus one year).
As we can see below:
Now, with a bit of formatting magic, we can combine these KPIs and provide context to the user.
Firstly, lets calculate the percentage difference.
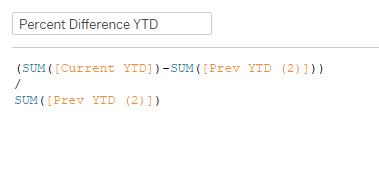
This aggregates the current and previous years to date, then divides the by last years profit to date to give the percentage change.
Now we can put these onto a text mark to create our KPI.
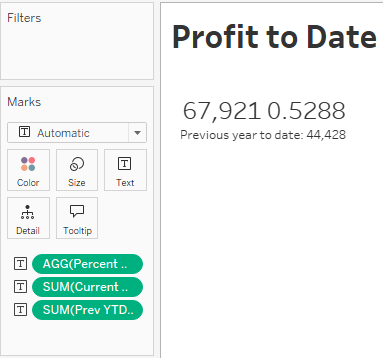
Whilst this does give us the information we need, it could look nicer, lets start by upgrading our percentage change with a custom number format.
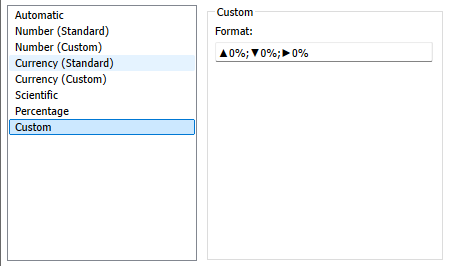
That gives us a KPI that looks like this:
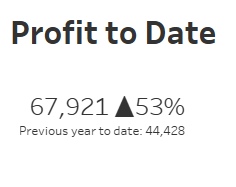
And there we have it! That's how you create a year to date KPI in Tableau, that gives context of the same period in the previous year.