


In this blog, I'll take you through my attempt at WOW 2024 W43, where we need to use proportional brushing to show total vs filtered sales in the same view. If you want to follow along then connect to the sample superstore dataset provided with Tableau.
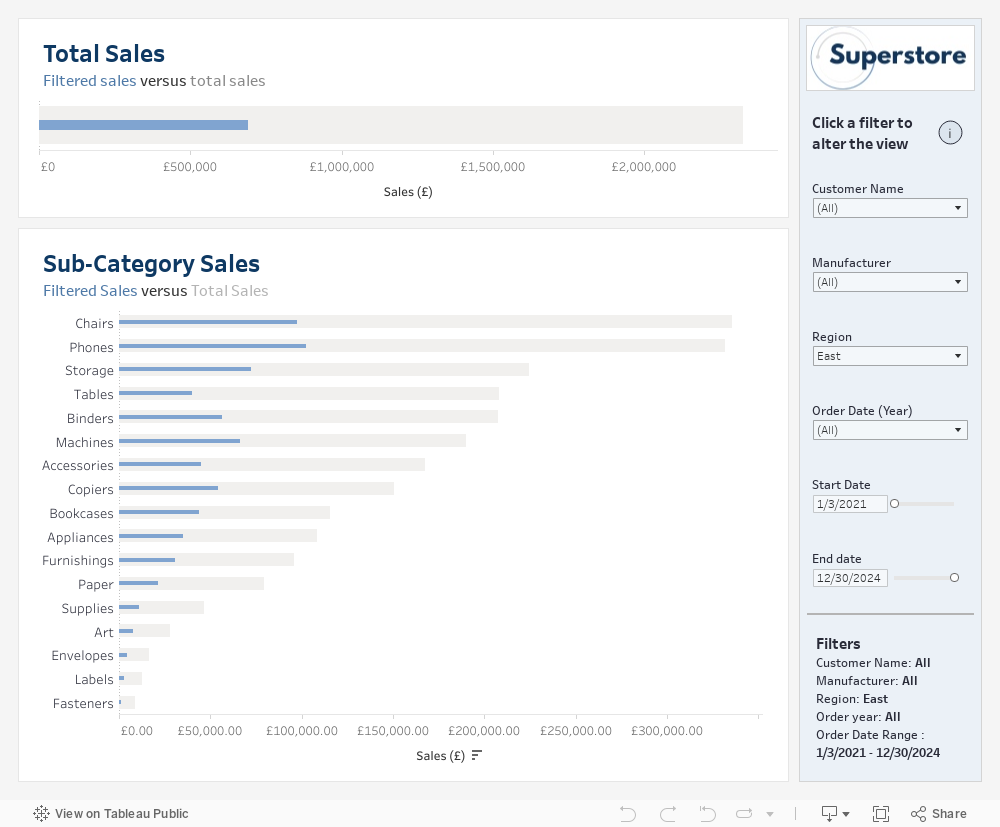
Hannah's solution - this is what we are trying to recreate.
Step 1.
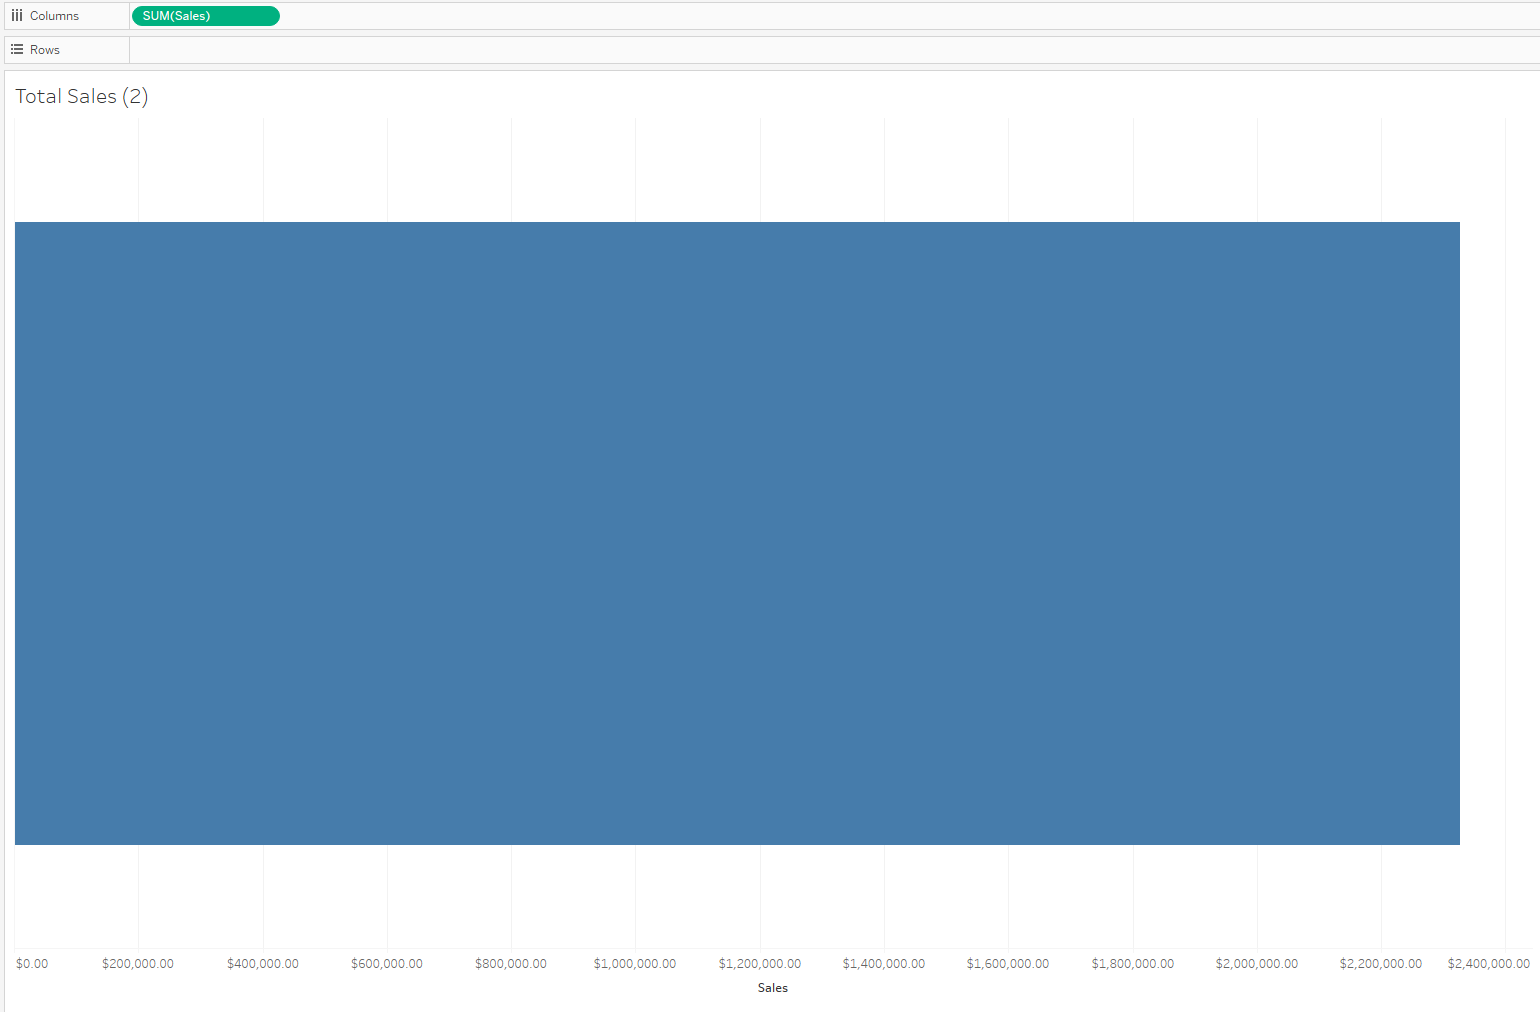
Drag Sales onto columns to get sum(sales), which we will use for our filtered sales.
Step 2.
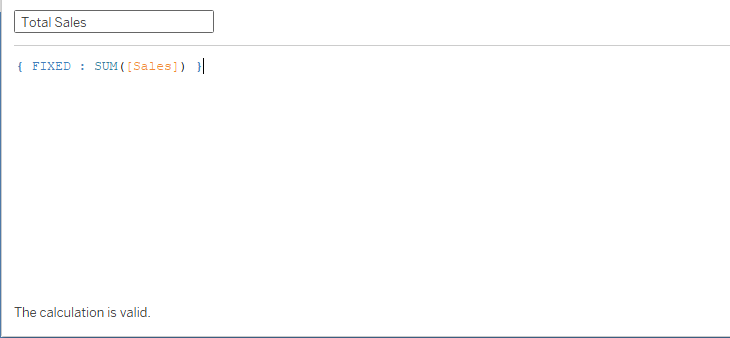
We need to always be able to see total sales, regardless of filters in the view. Therefore, we can create a fixed level-of-detail calculation as seen below.
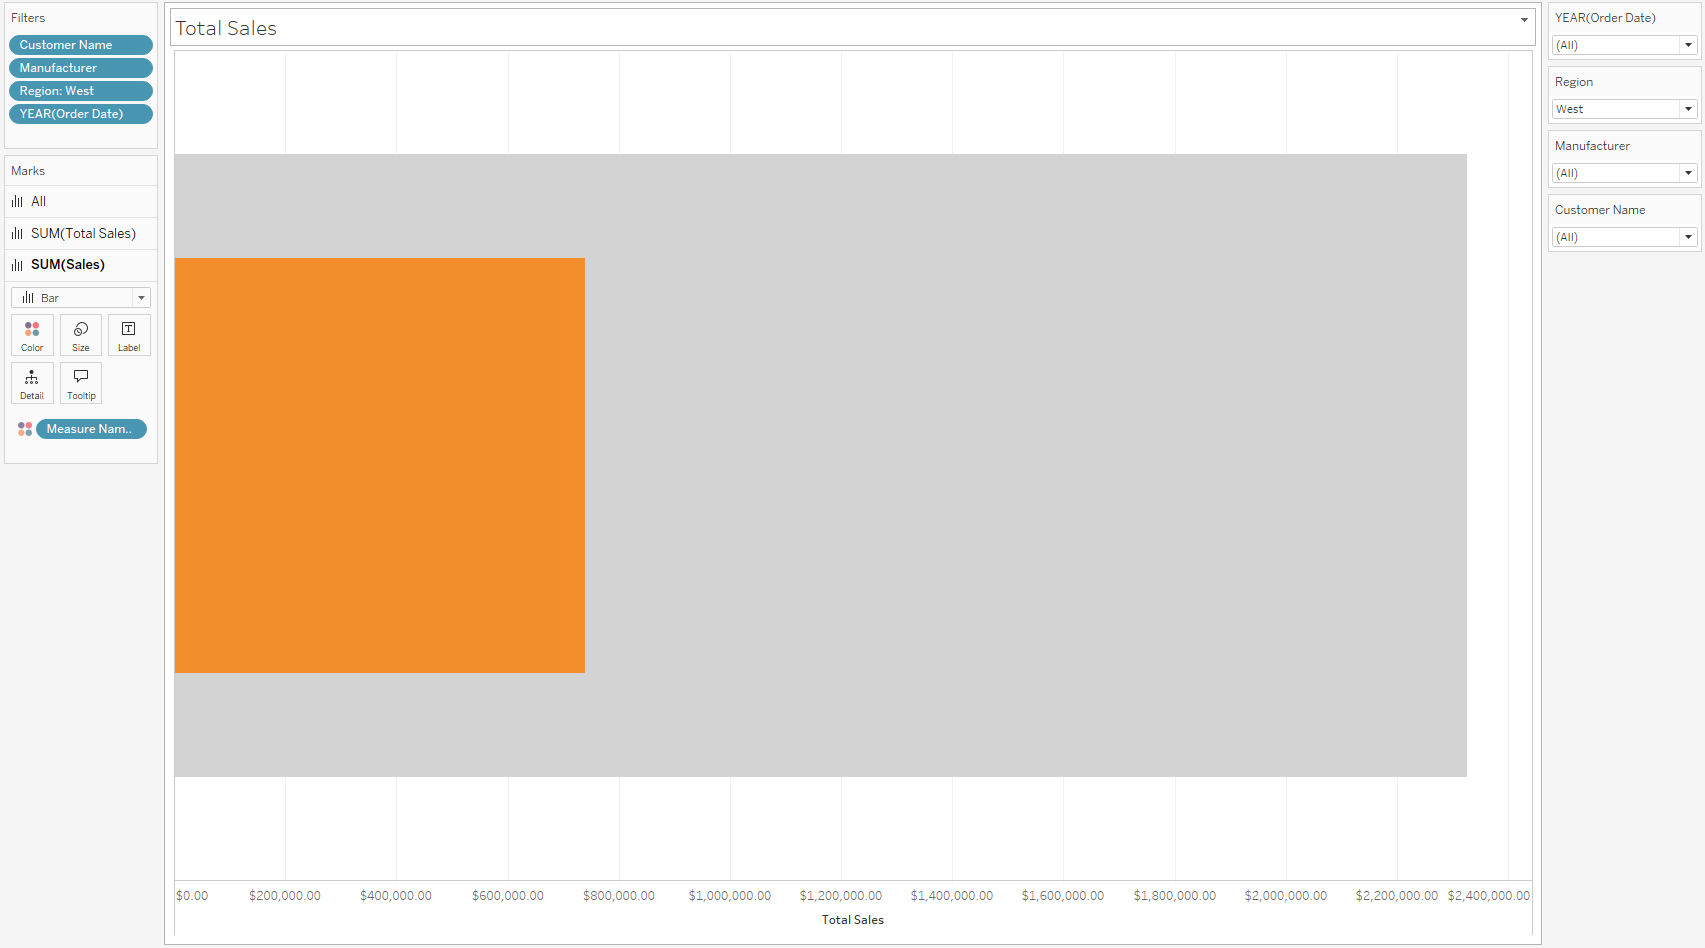
We then drag this onto rows and right click -> dual axis (remember to synchronise!). If we then change colours and size so we can see both bars we should get something that looks like this:
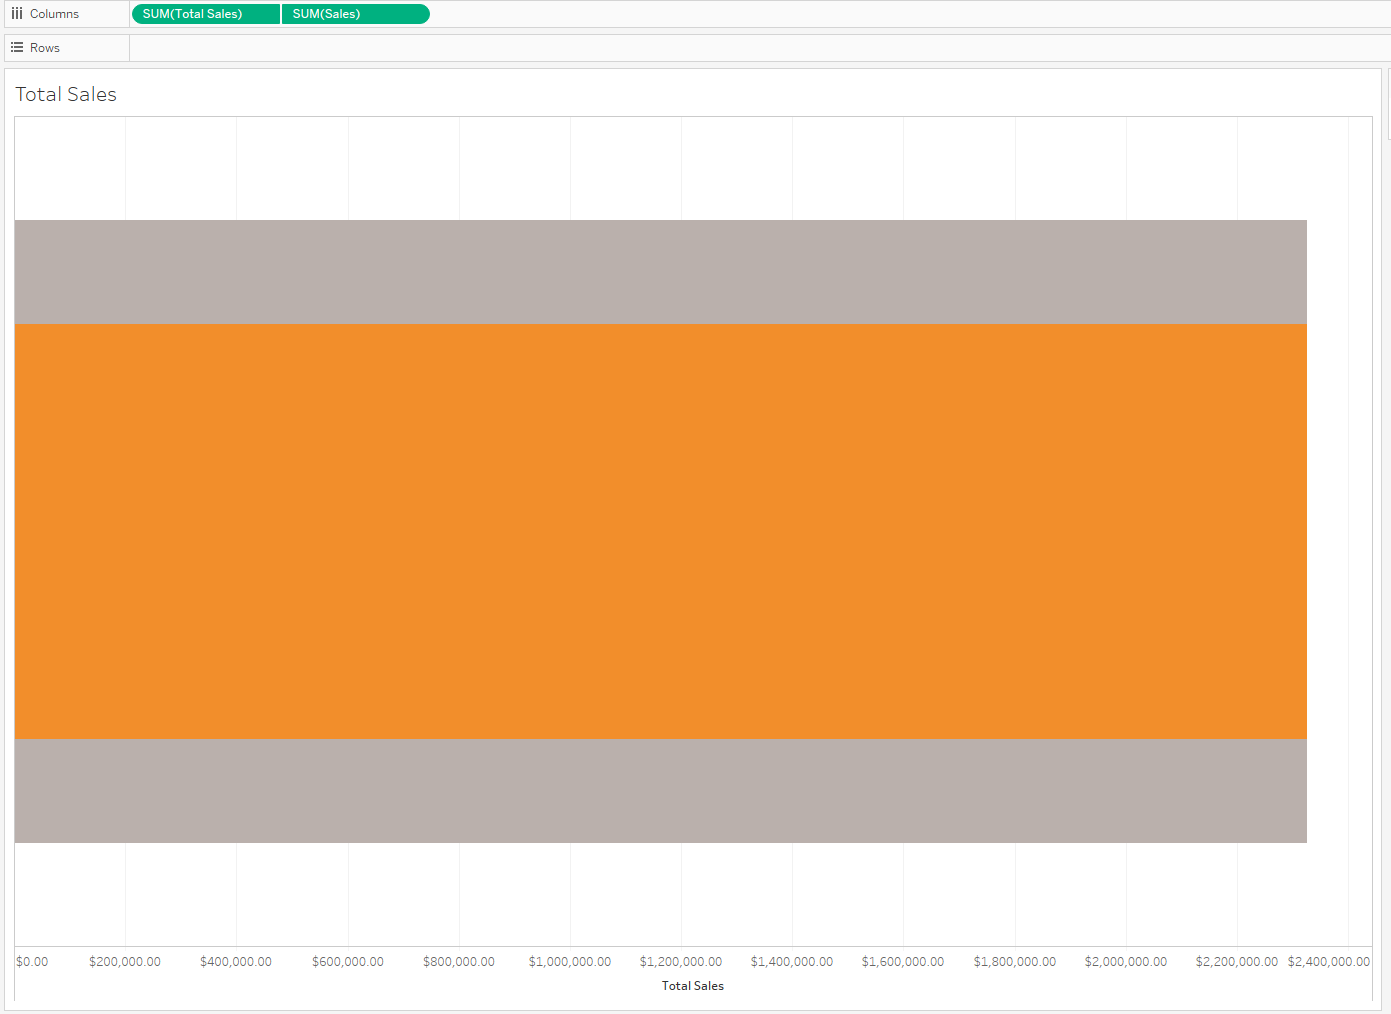
Right now, the bars are the same length, as there are no filters applied to the view.
Step 3.
Time to add some filters, drag in Manufacture, Region, Order Date and Customer name into the filters pane. Next right click them and select "show filter", before then changing the formats to single value dropdown.
Step 4. Recreate this broken down by sub category.
We can start by duplicating our sheet, by right clicking it and selecting 'duplicate'. Rename this total sales by sub-category and then add sub-category to rows.
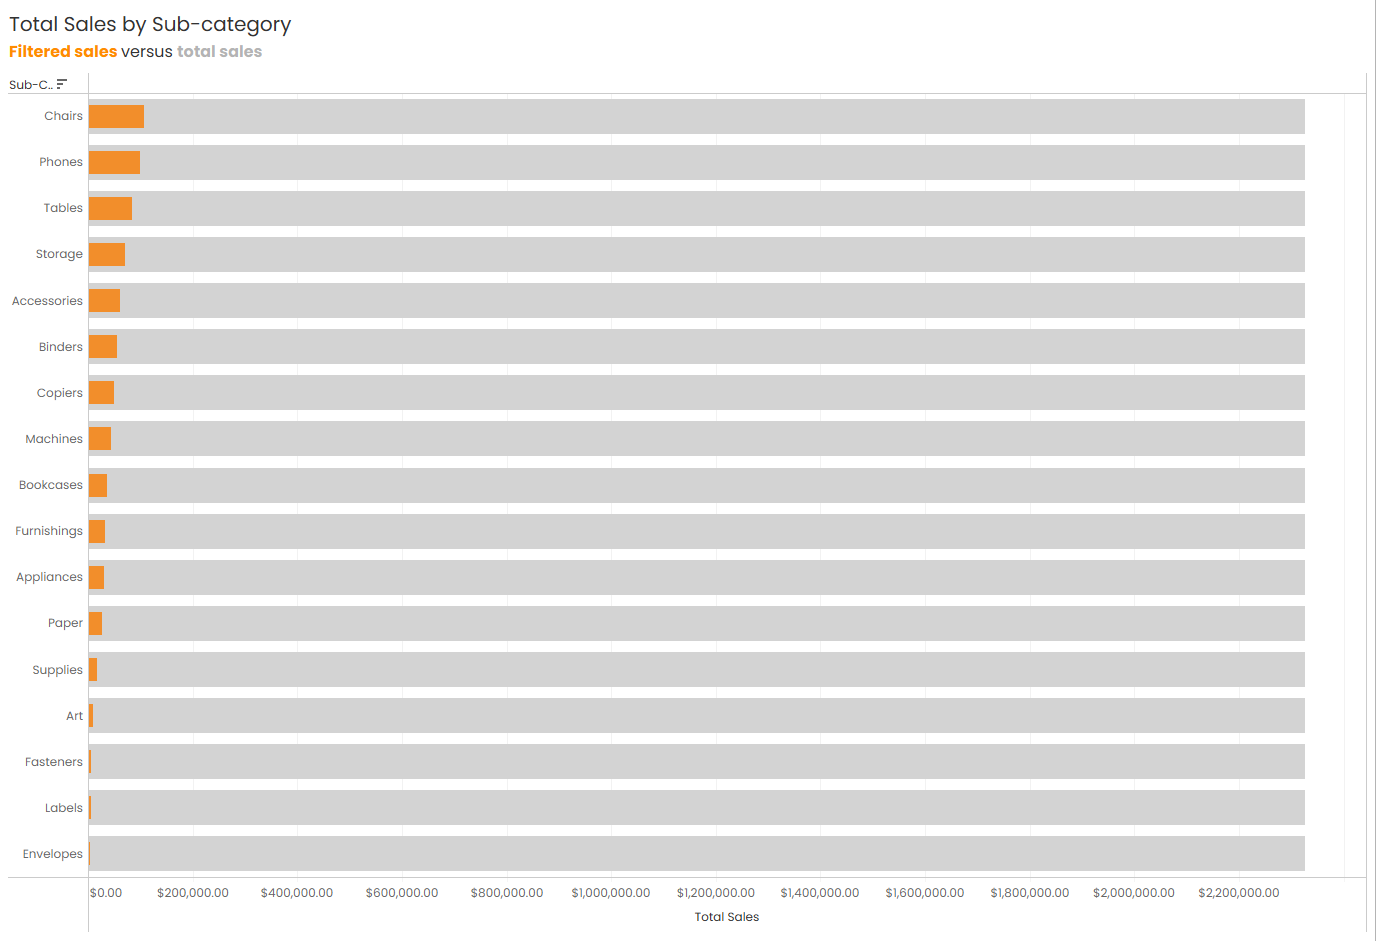
We can see that this doesn't give us the correct 'total' by sub-category, because our fixed LOD needs to consider this field. Let's update that now and see the difference.
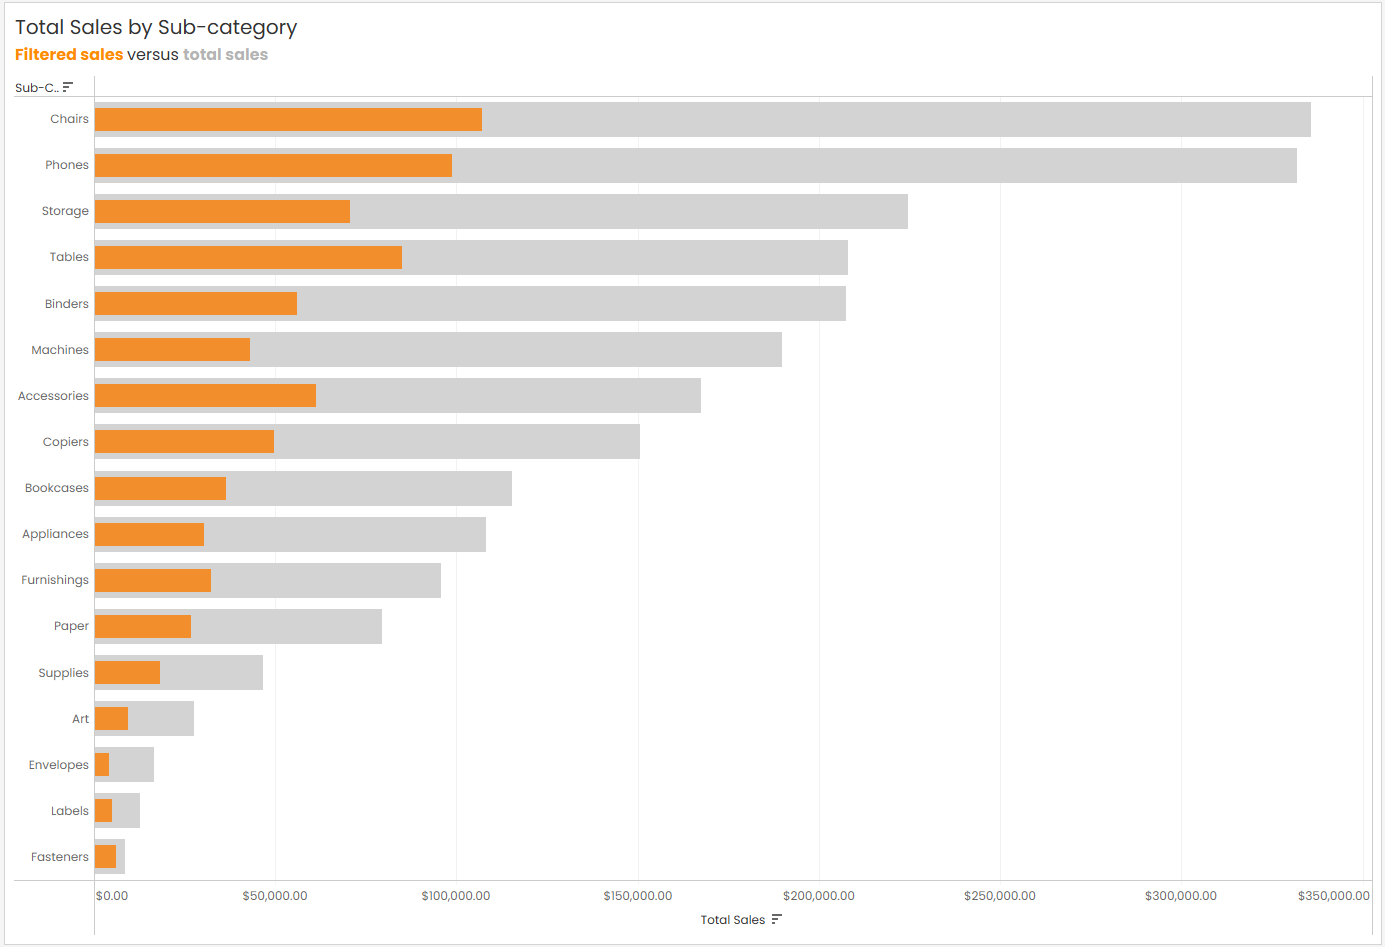
This doesn't impact our previous chart because sub-category is not breaking up the view. And now with some formatting we can end up with...
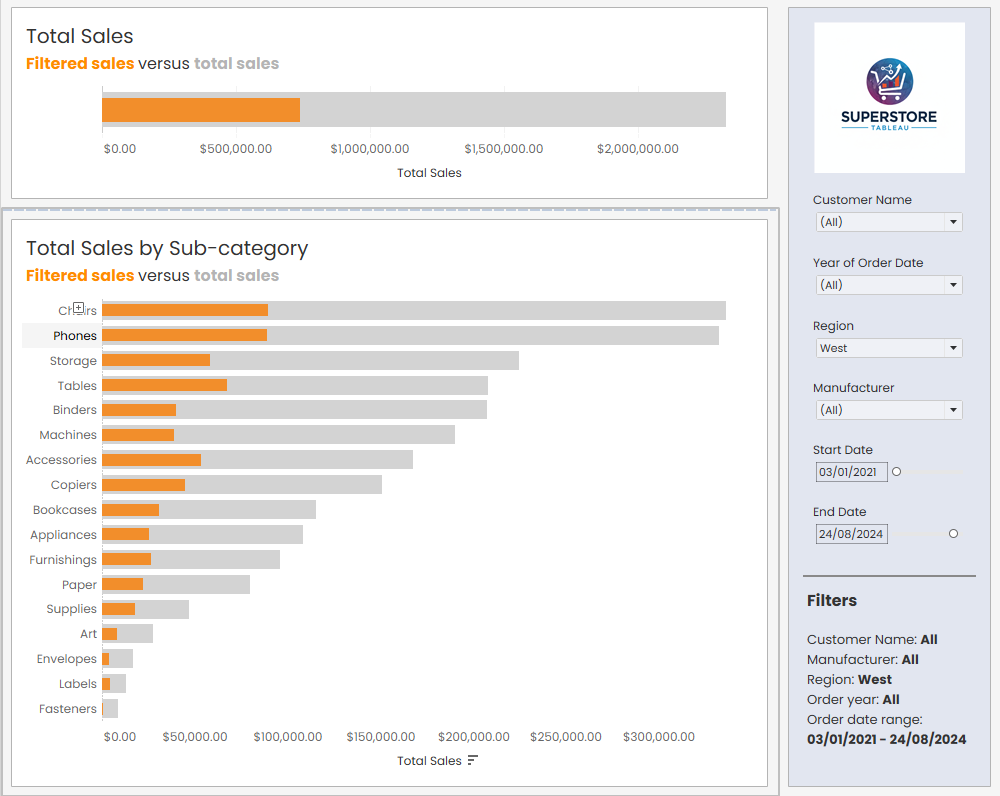
Voila! Feel free to view on my Tableau Public here and as always happy to help and respond to any and all questions.