Imagine you want to show multiple charts with different metrics (such as “Sales” or “Profit”) on a dashboard. Imagine you also want to include some unrelated visualisations on the dashboard.
The problem is that showing all of these charts at the same time would result in a cluttered viz.
Fortunately, you can use a parameter in Tableau that allows a user to select the individual metrics they want to view in a single chart. Thus, if previously you had two charts on your dashboard to show two different metrics, you can simply use one chart with a parameter to allow the user to choose which metric they want to view. This saves space on your dashboard for you to include other vizzes if you want.
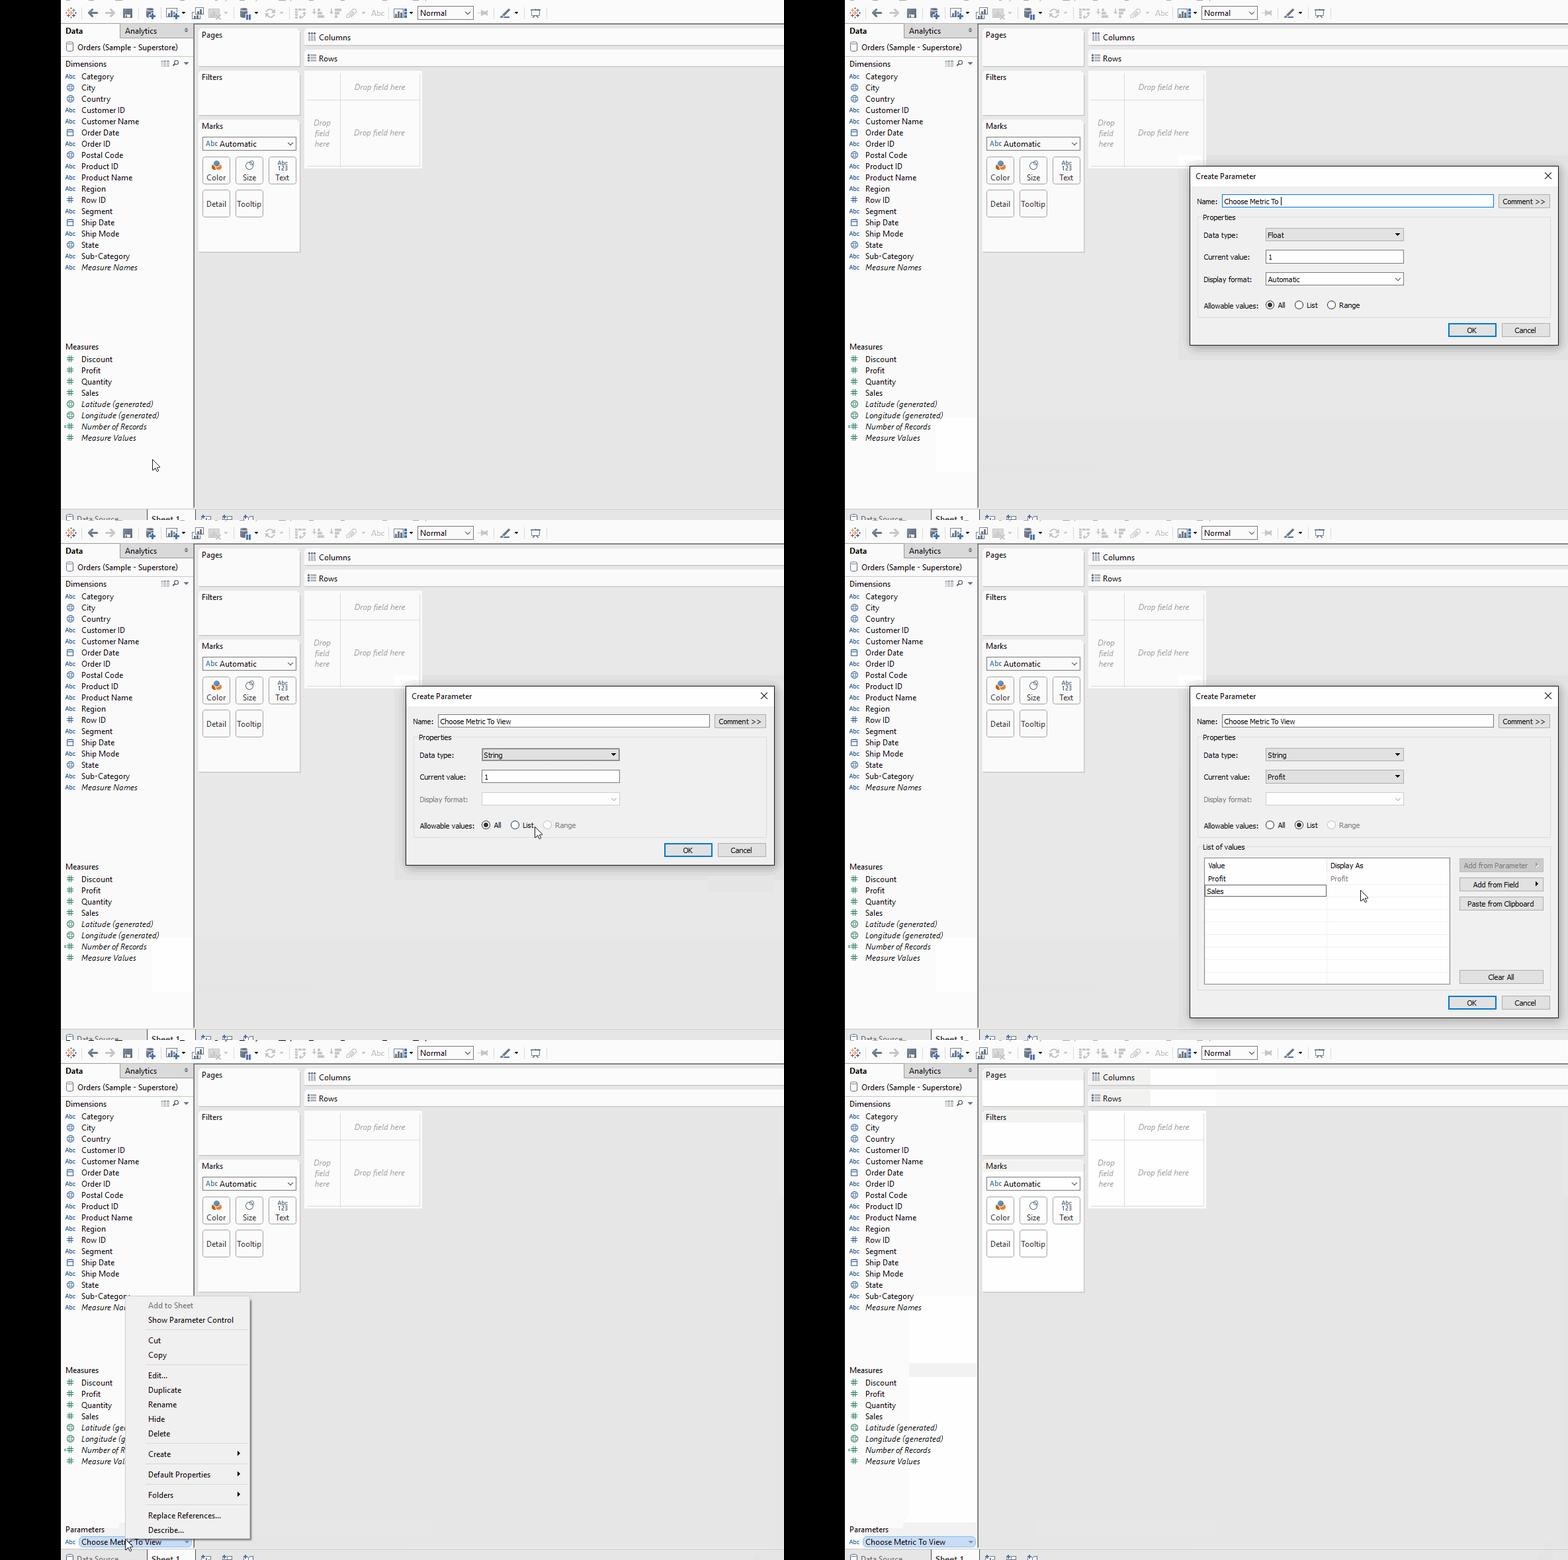
First you need to create a parameter, containing the names of the metrics you want to show (in this example “Sales” and “Profit”). The GIF below shows how to do this:

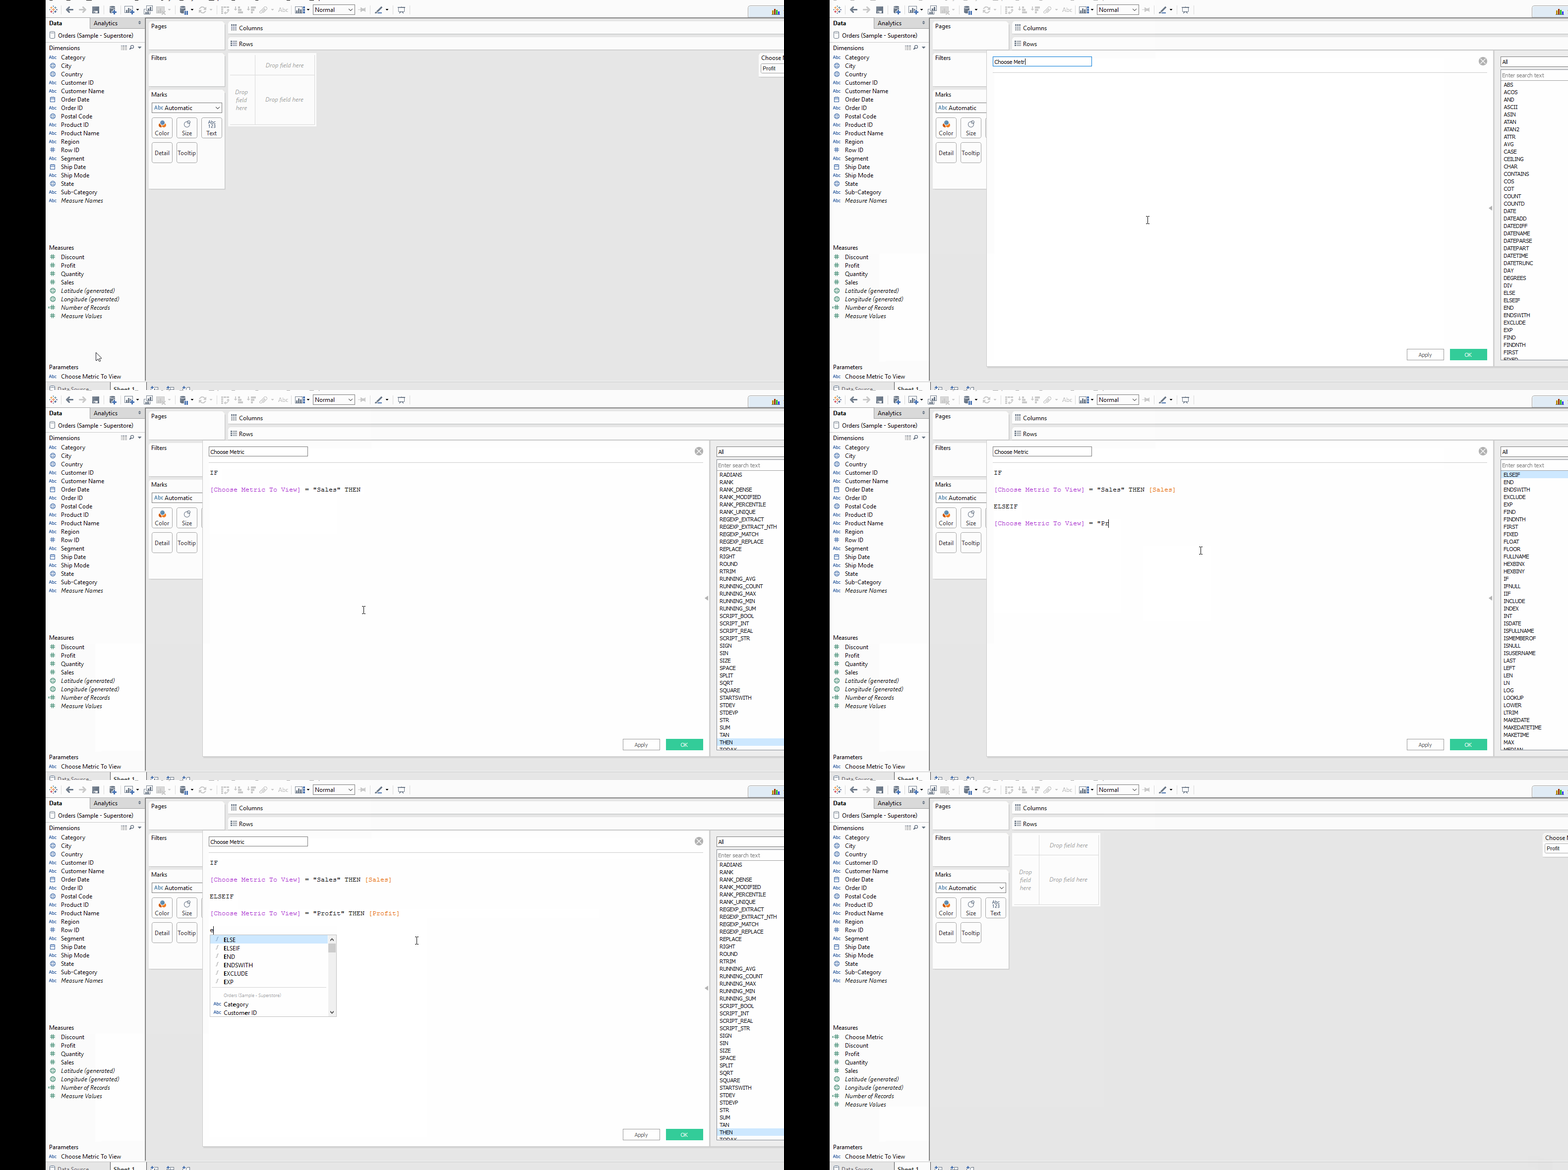
Now you need to create a calculated field to define your parameter. The GIF below shows how to do this:

(The calculation text is
IF
[Choose Metric To View] = “Sales” THEN [Sales]
ELSEIF
[Choose Metric To View] = “Profit” THEN [Profit]
END)
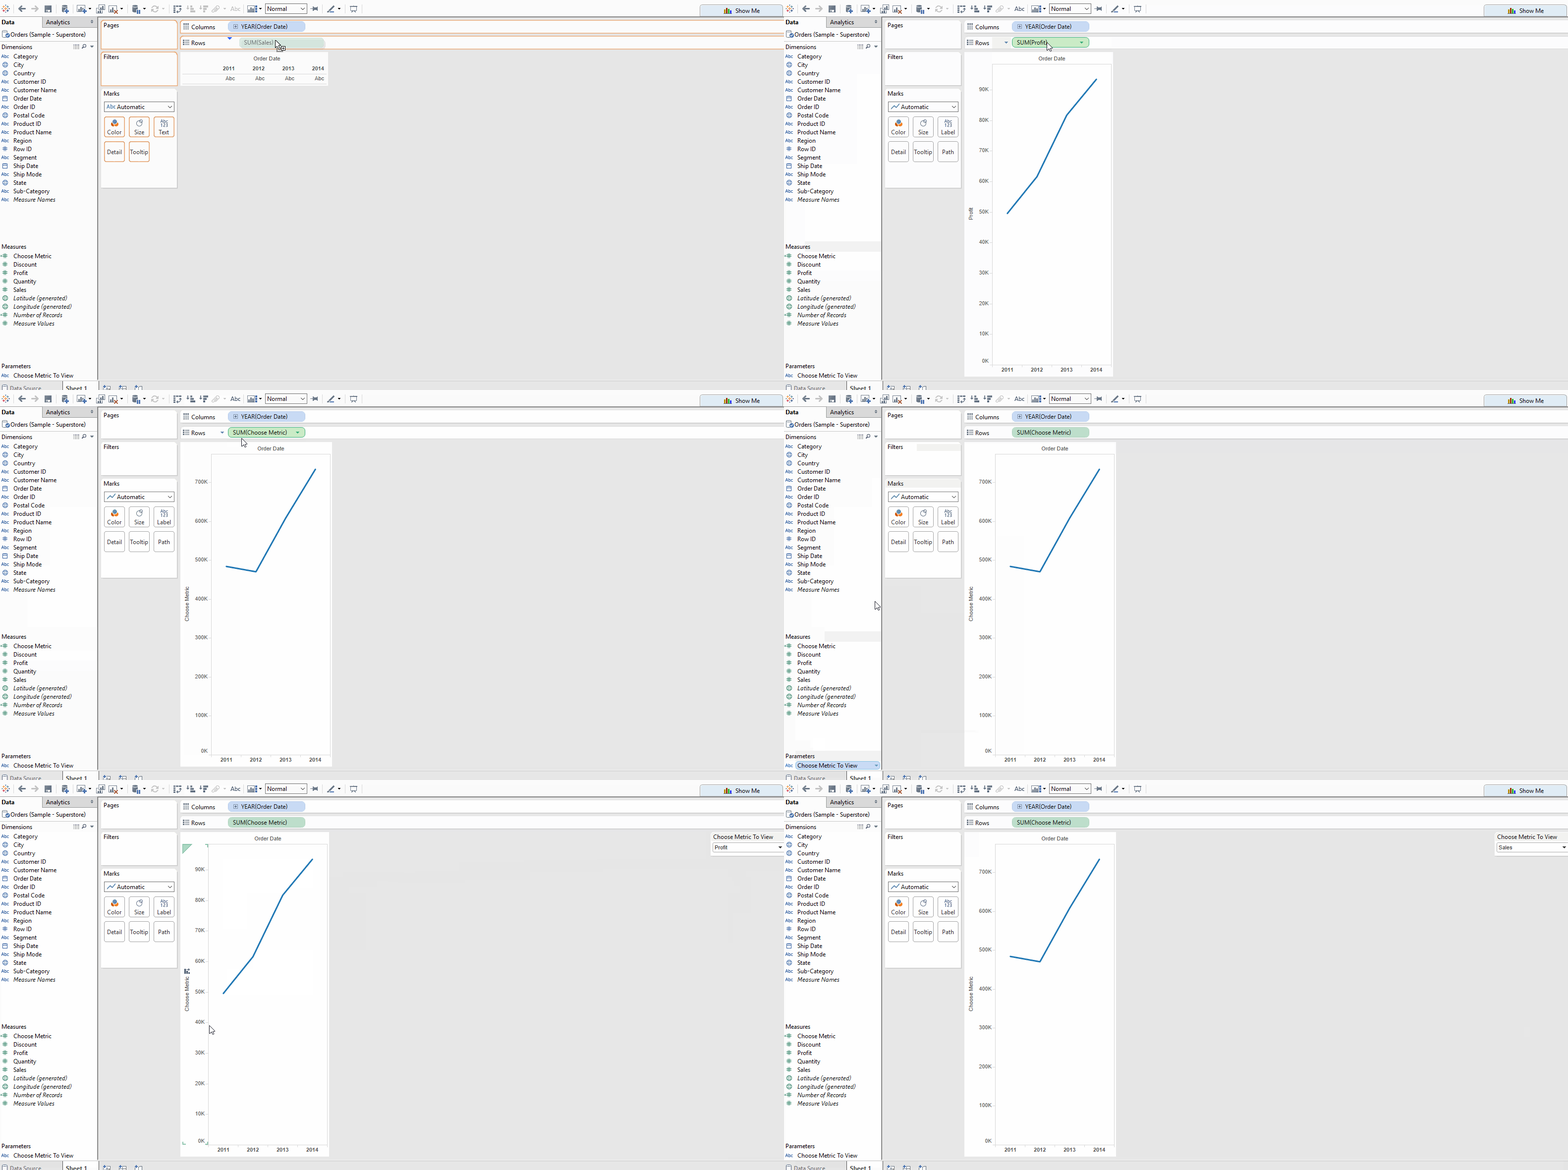
Now you simply show your parameter control and drag your calculated field controlling your parameter to either rows or columns. In this example view, I have put “Order Date” on columns already. Then you can use your parameter to switch views, as shown below:

