


Following on from my previous post about how Chelsea disrupted the Premier League title race (read the blog here), it’s interesting to look at how Chelsea also impacted transfer fees.
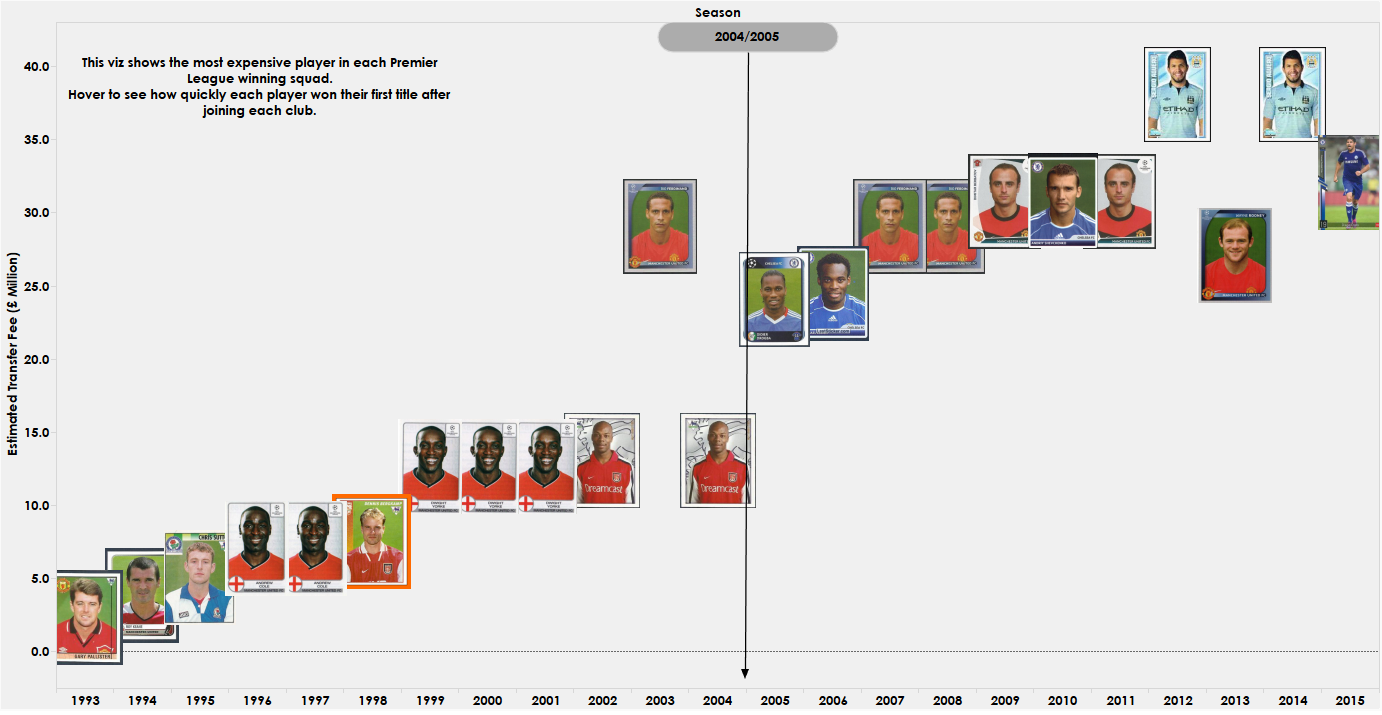
This can be done in Tableau with a very simple visualisation using custom shapes – this was one of my first vizzes in Tableau. It focuses on the price of the most expensive player in each Premier League winning squad. By hovering, the user can also find out how long it took each player to win their first title at the club.
The distribution after 2004 is interesting – explore the viz by clicking the screenshot above!