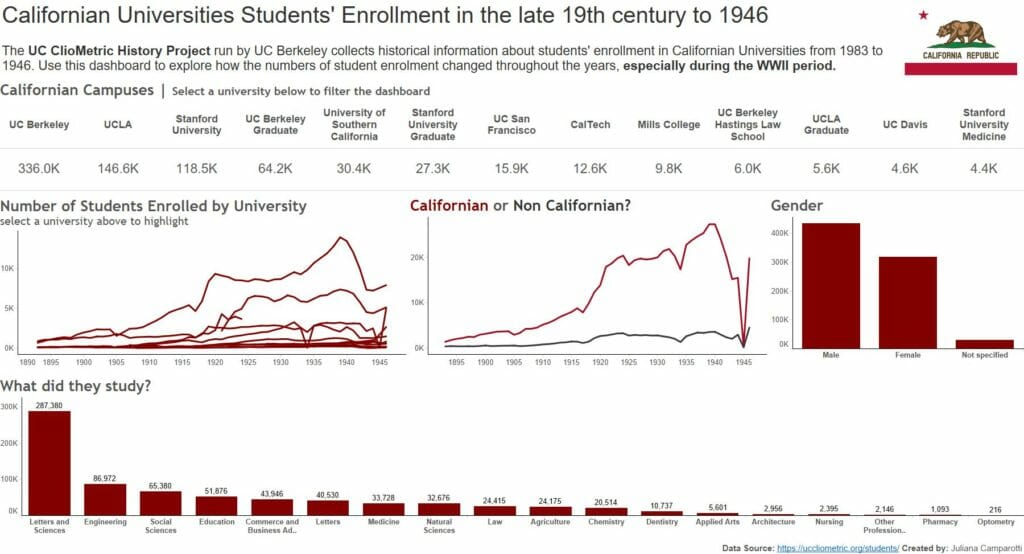
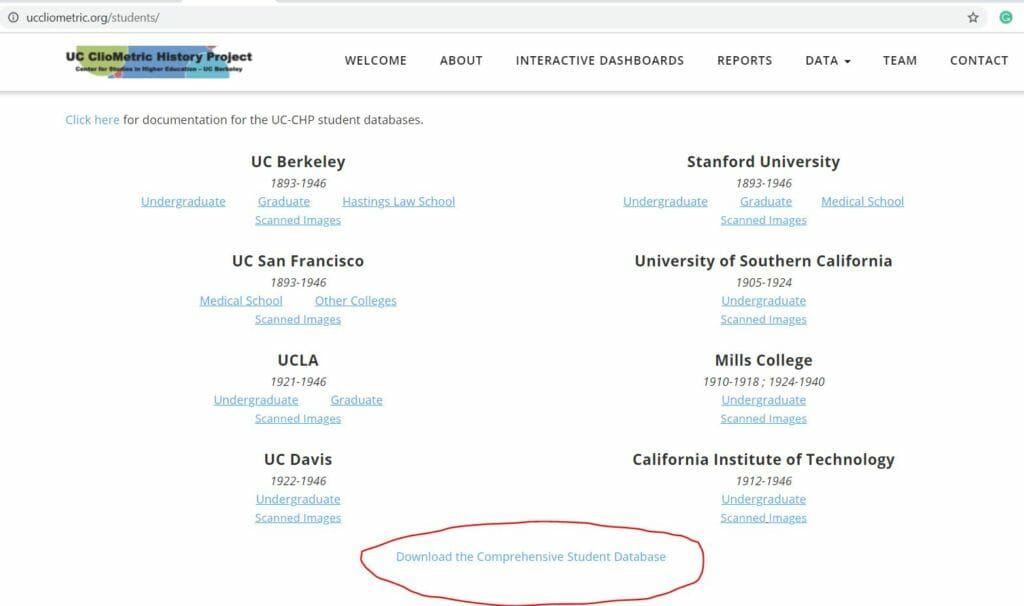
Today we were given the oldest data set I’ve ever worked with. It is about the Californian Universities Students’ Enrollment in the late 19th century to 1946. The data was not hard at all to collect. With only one click we download the whole data in an Excel file. The biggest challenge was that we had to analyse it using Tableau version 8.3!!!
And you get a table very well organised and clean.
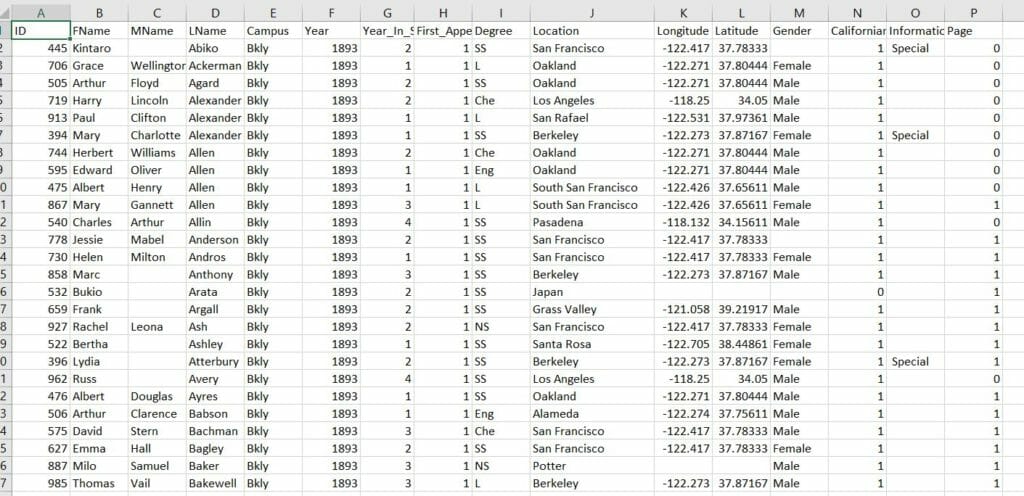
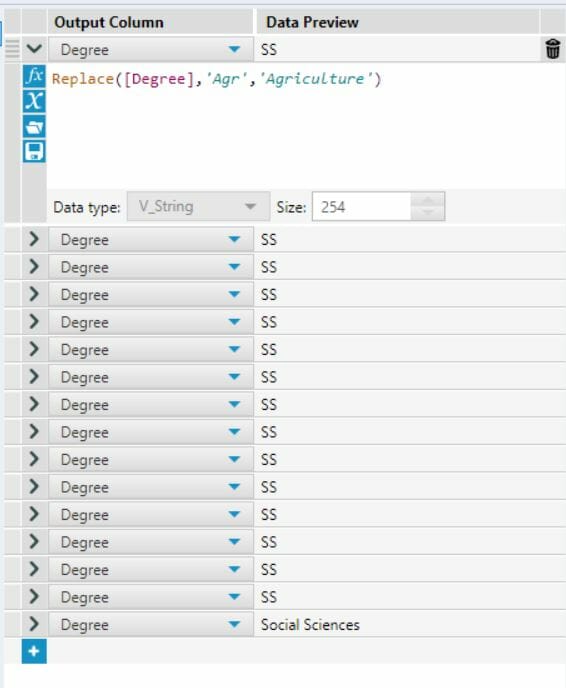
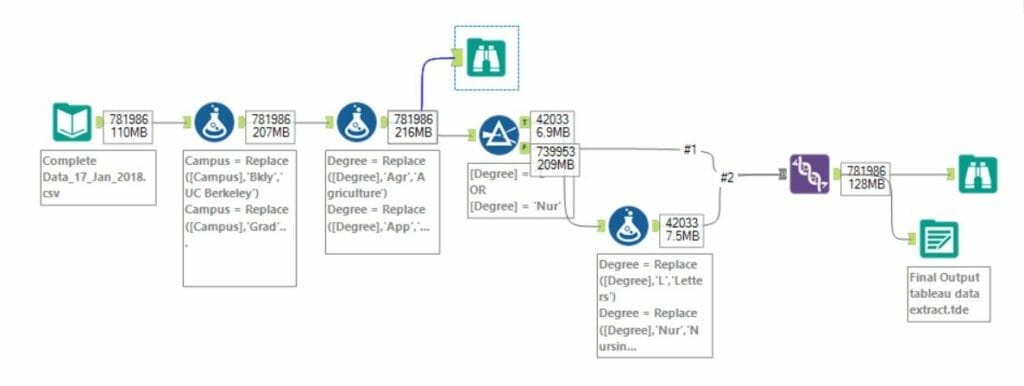
The only thing I had to fix was the Campus and Degree names, which I wanted to be written in full extension. So I used lots of formulas in Alteryx for that.
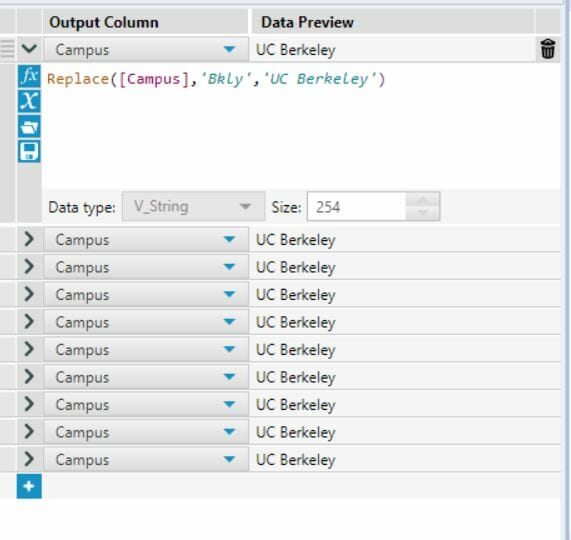
But the final workflow was concise:
Bringing it to Tableau was also not a big deal, we only had to make sure we save the output in a readable format for the 8.3 version. And .tde was one of them.
I had so much in mind for possible visualisations I could do, but I had only half of my day to do the whole thing, as I was assigned to help with a Tableau Essentials Teaching the Public session for the entire afternoon, so I didn’t have much time to dive into it. I ended up doing a basic overall overview of the number of enrolments, universities, gender and degrees. It was very interesting to see how the number of enrollments decreased during the WWII period.