


First thing 9AM on a Monday, this time we are tasked to build a dashboard using information on Cheese.com. Since there wasn't any dataset provided on the website, I decided to use Alteryx to scrape the website. My idea for the dashboard was originally on the pairing of wine and cheese, but I pivoted to the idea of exploring goat's cheese. As a cheese lover myself, as well as lactose intolerant, I've decided to build a dashboard that lets the user explore goat's cheese as it is definitely a lot easier to digest than regular cow's milk cheese.
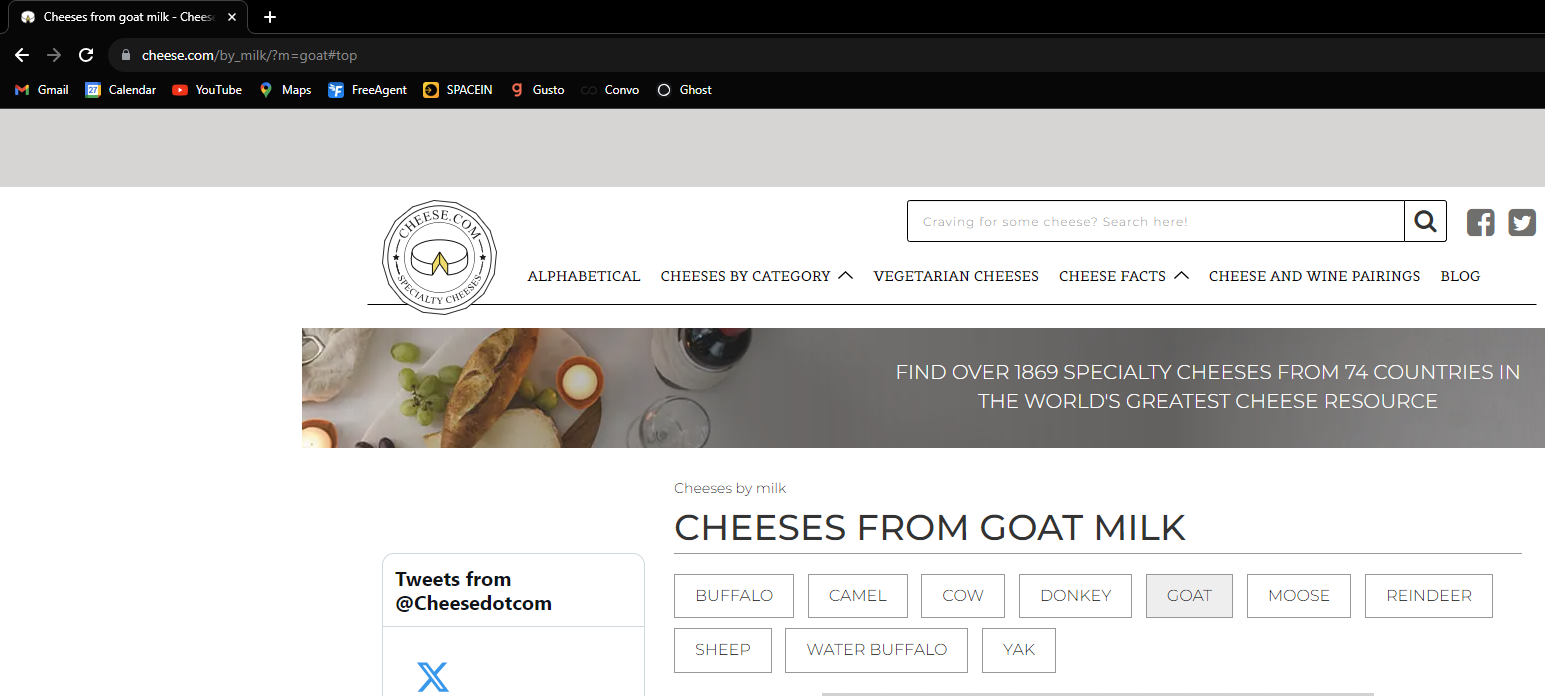
To start off, I limited my web scraping to two parts. Firstly, I had to find a list of goats cheese. This was rather easy since I could just navigate to a page of the shows only the names of cheeses that were made using goat's milk.
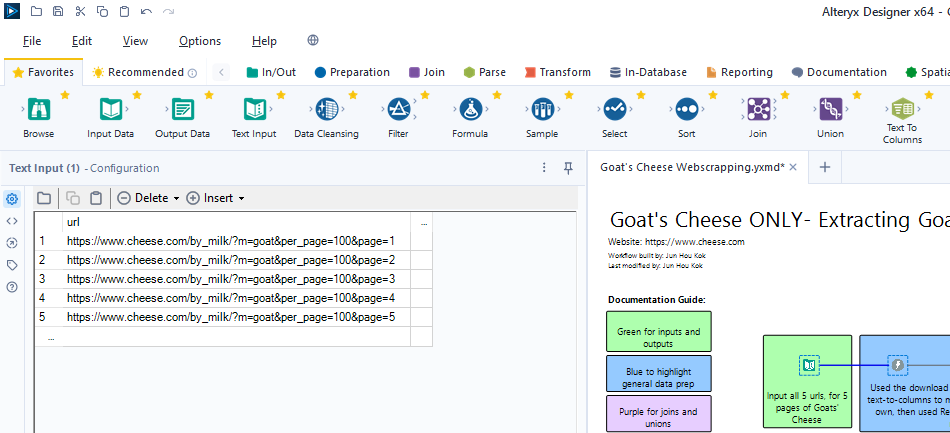
Then I went over to Alteryx and used an input tool and input the 5 URLs I was using. This is because each page was only showing about 100 varieties of goat's cheese, and there were 5 pages total. Afterwards, I simply used the download tool to extract the data I needed.
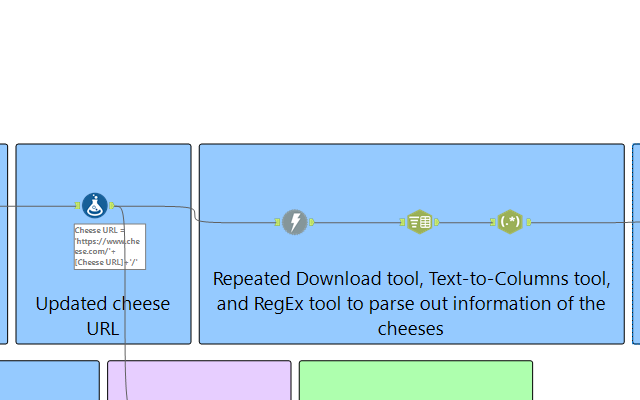
After I done some data cleaning, I needed more detailed information on each of the cheeses, so I repeated the process of using the download tool, this time however, I used a formula tool to create a new column that consisted of the cheese name and the URL that is linked its individual page.
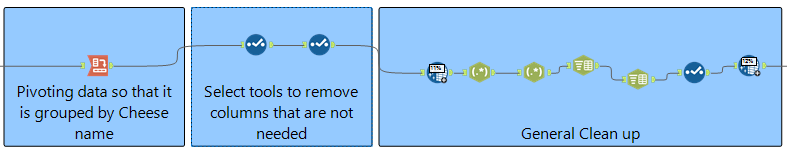
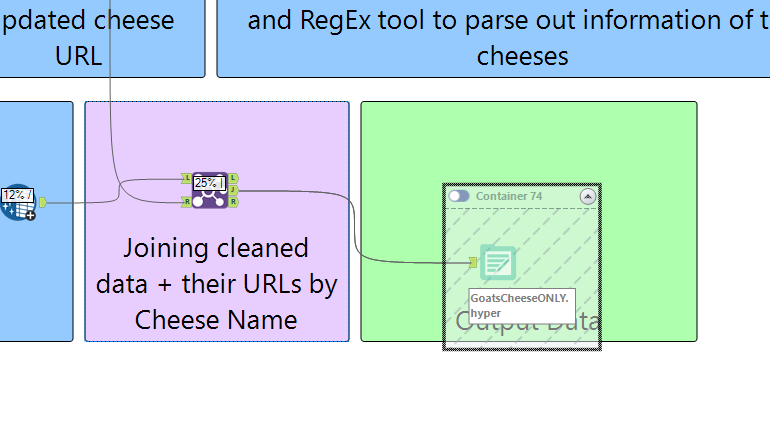
At this point, I've encountered some obstacles since the most I could do with a RegEx tool was not clean enough so further manual cleaning steps were taken. When the data was clean enough for me to work with, I used a crosstab tool and pivoted the data so that it is group by the cheese's name. Some further clean up was needed, so I used some select tools to find which columns needed to be unticked and renamed.
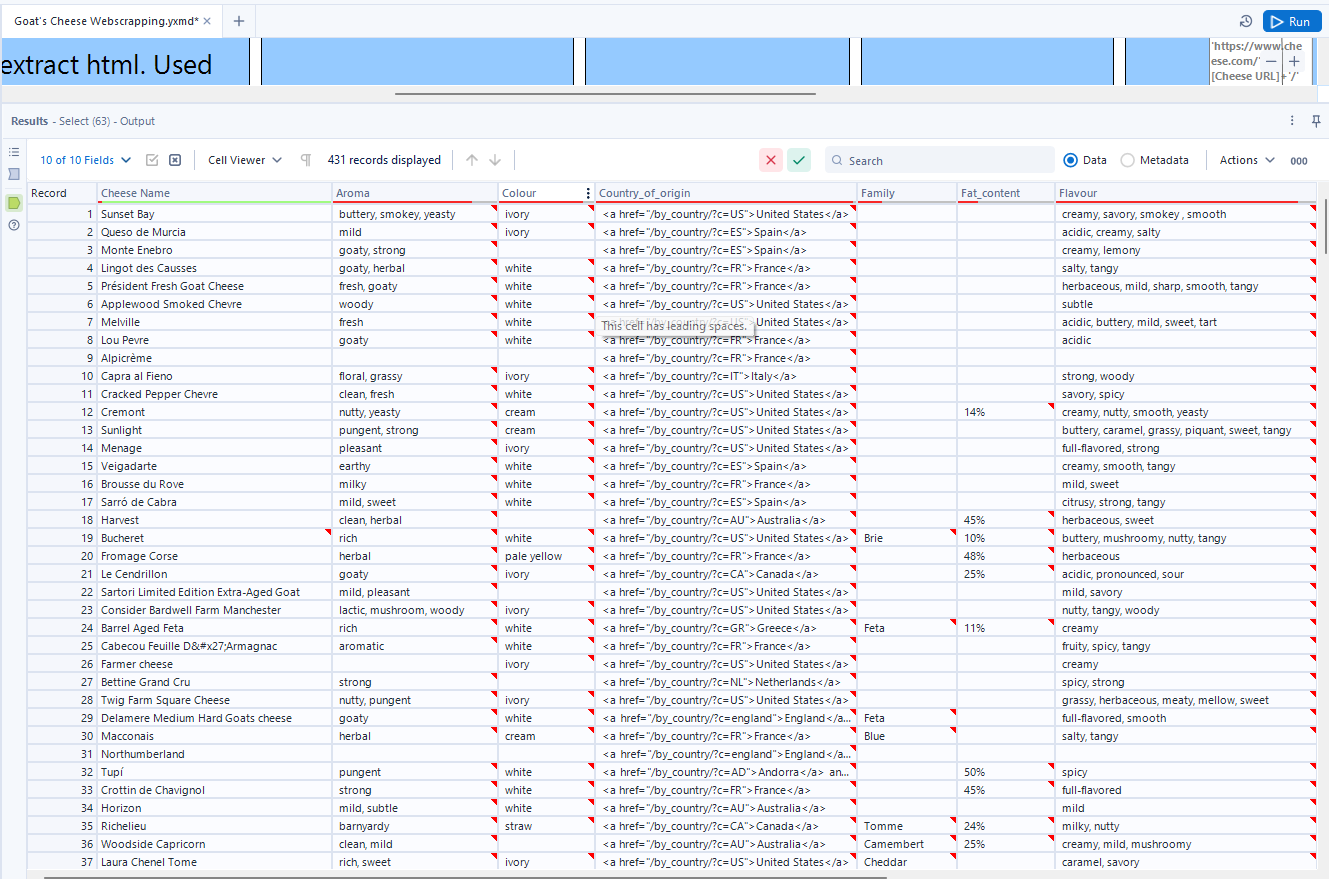
Finally I joined the data back to the first dataset I generated to bring over the URL associated with the page, and exported the data as a hyper file since I was going to open it on Tableau.
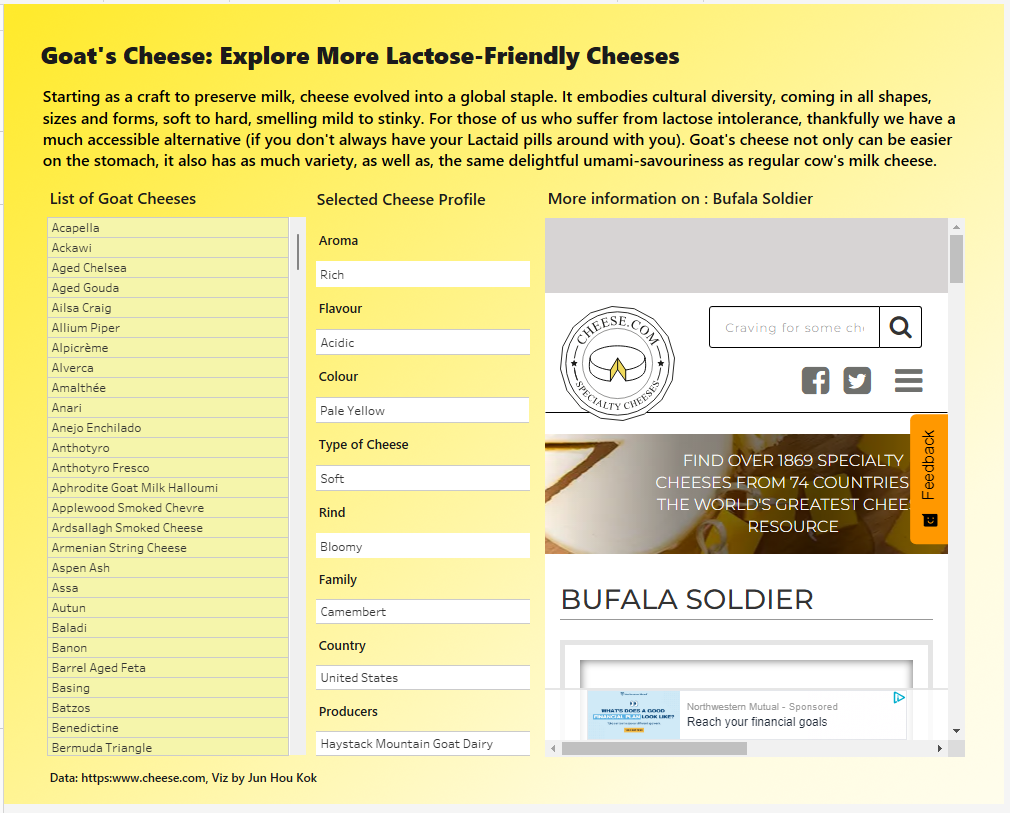
With my dataset cleaned and ready, I went over to Tableau and built my Goat Cheese Explorer. The dashboard allows the user to view a list of goat cheese names and select it. Upon selecting the cheese, the profile sector will populate according to the cheese and display information such as the Aroma, Flabor, Color, the Type of Cheese and other information about the cheese. I've also inserted a webpage object that will filter to the cheese selected and the user will be able to browse cheese.com on the specific cheese selected and learn more about it.
This is challenge wasn't particularly hard because I had a dashboard in mind that I wanted to build as soon as I saw the website, but I spend the majority of my time on Alteryx, scraping and cleaning the data so that it fits nicely to my needs when I have it opened on Tableau.