


For today’s dashboard week task, DS 25 had to look at the “Most commonly consumed Vegetables by Americans” data available on the website of USDA.
The requirements were to create a sketch before having a thorough look at the data, prep the data in Tableau prep and prepare a dashboard and a blog from the same.
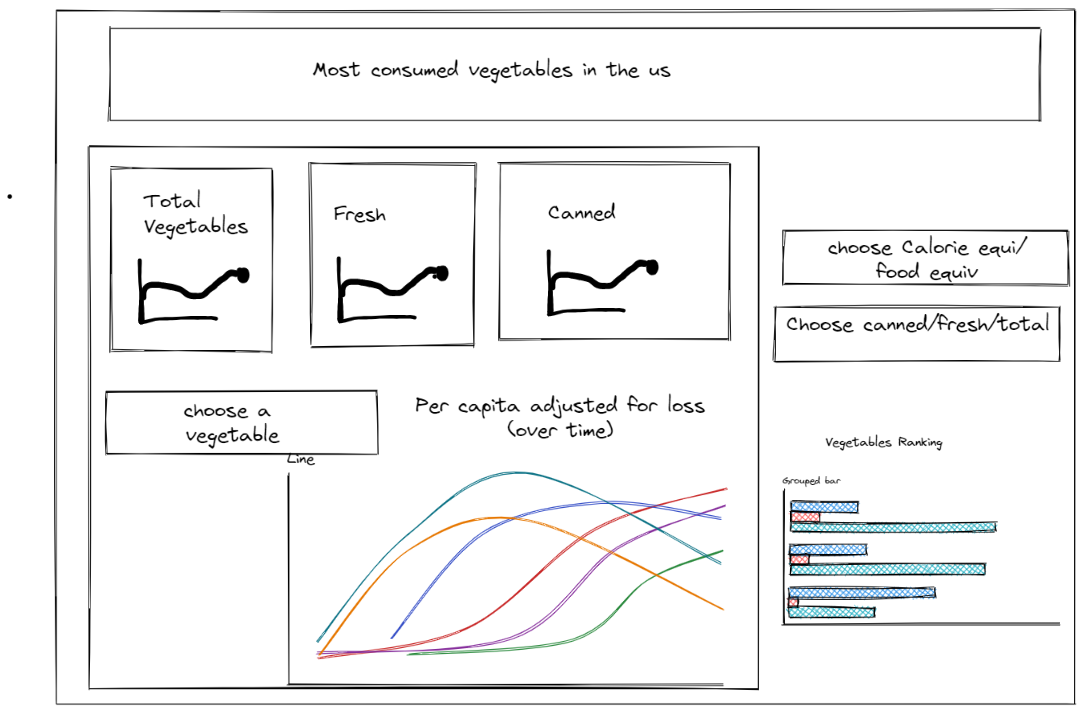
Creating a sketch before starting working on data was a bit of tricky part for me as I had to pre plan what fields I will be keeping and how. Nevertheless, after having a look at just one file I did come up with a sketch. I decide which fields I will keep and which I can neglect. The sketch I created looked like below. But at that point I knew, I might have to update it going forward.
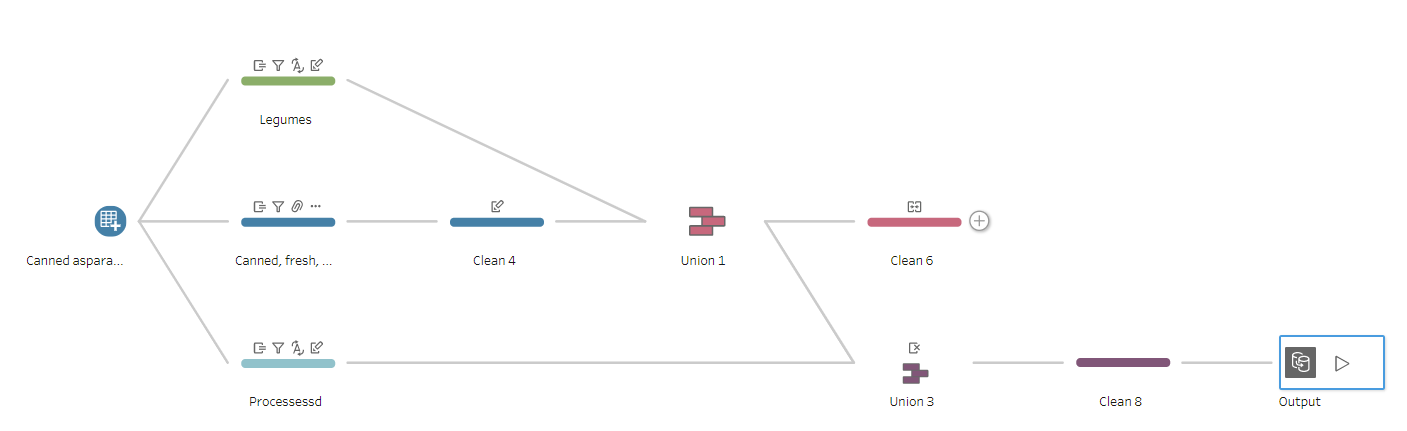
I used single excel workbook titled “Vegetables” from the Loss adjusted food availability category on the USDA website. It had multiple files. First and foremost, I used the data interpreter to get the fields names as headers. Then I needed to categorized the files depending they are for frozen, fresh, canned, etc.. To do this, I used wildcard union. In first union, I bought in all canned, frozen and fresh category files. Then I bring in Legumes and processed foods separately and union them on first table. This gave me single table with different categories. I did some basic cleaning and my data was ready to be imported to tableau.
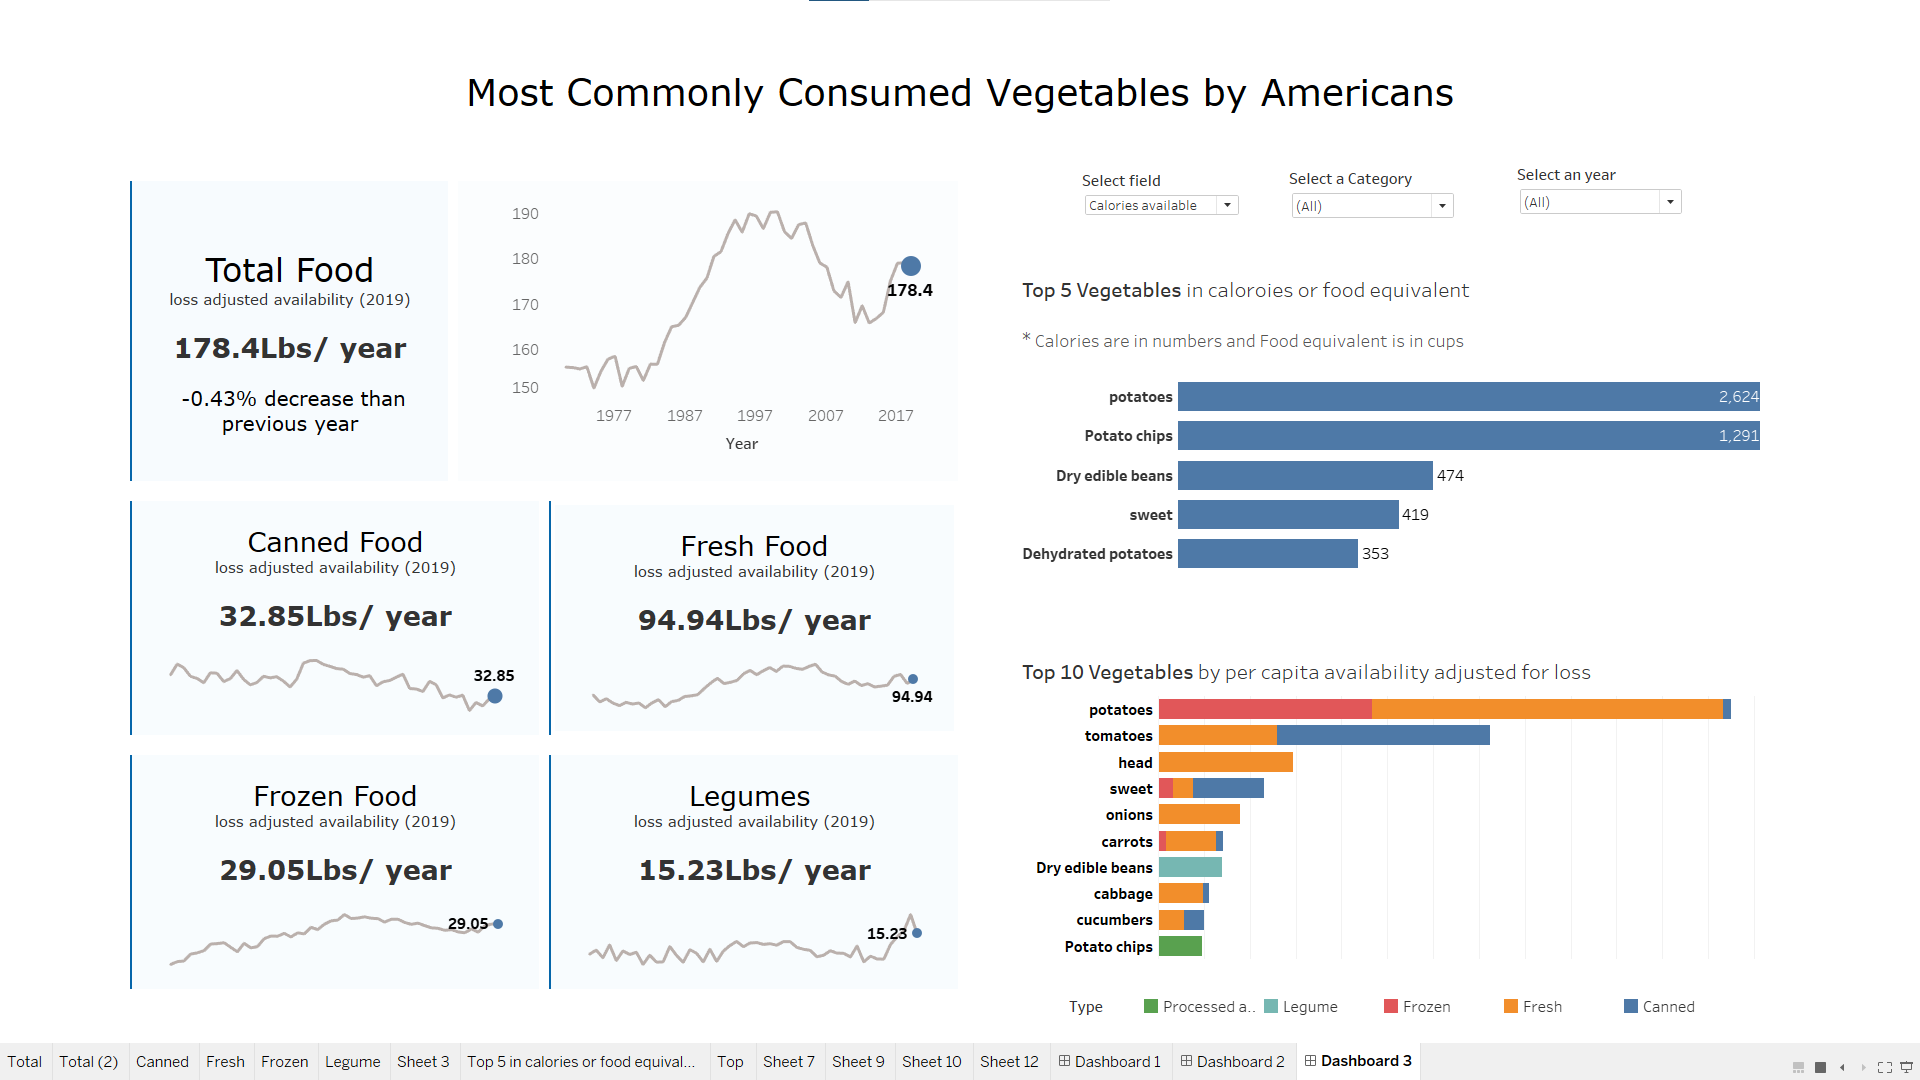
With the data available, I decided I will be doing some KPIs on different categories as in today’s requirement, the ask was to create KPI style Dashboard. For KPIs, I also wanted to incorporate the sparklines as they give more context to the Big Numbers. The dashboard I created is shown below:
Challenges:
The first challenge for me today was in data prepping. I had multiple files and I wanted to union them. It took me some time to figure out how to get all the sheets in single table, keeping the category in the table. It took away most of my time and I had very little time left for creating the dashboard. When I started on Tableau, I was facing multiple technical issues as well, which further delayed me. Lastly, the parameter I created to filter my chart suddenly started acting weird, once I bought the file on dashboard. All these are small issues which could have been dealt with easily given the time. But Time is always what we are short of during Dashboard week!!