


Creating parameters in Power BI is a lot more straightforward than you might think. Power BI has predefined capabilities for creating these with ease, which makes them nice and simple to create and add in to reports to enhance interactivity. I have written a blog on creating parameters in Tableau, so take a look there if you need a guide for that, but for this blog we will be focusing on Power BI parameters, specifically fields parameters.
Parameters are powerful tools that allow users to make reports more dynamic, flexible and interactive. Whether you're filtering data, controlling calculations, or enabling custom date selections, parameters can be really useful for enhancing the user experience.
In this blog, we'll explore how to create fields parameters in Power BI, and how to implement them for dynamic reporting.
There are two types of parameters that you can make with ease in Power BI - fields parameters and numeric range parameters. To create either of these, click into the ‘Modelling’ tab at the top of the page, then navigate to ‘New Parameter’. Then, select a Fields parameter.
Fields parameters:
When you create a fields parameter, the following pop up will appear:
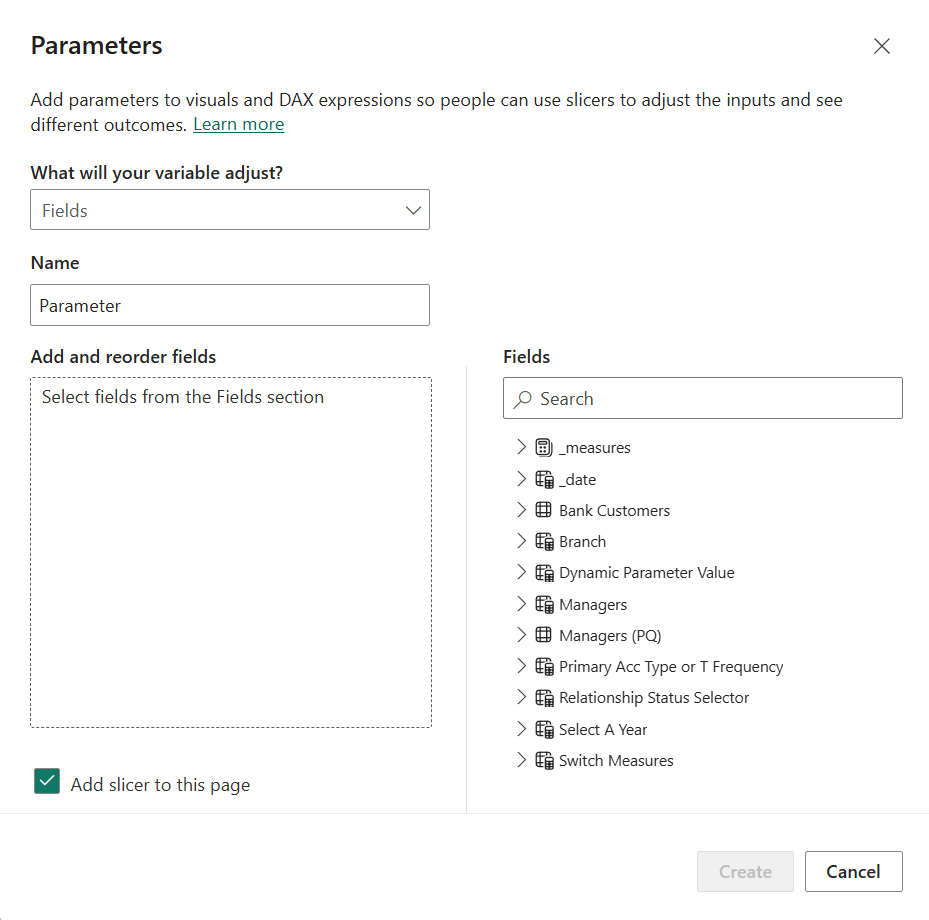
Here, you can specify the conditions of the parameter.
- Give the parameter a relevant name (one that you will remember!)
- Add and reorder fields. You can add these from the fields displayed on the left. If you want to create a 'Switch Measures' parameter to change the view of a visual based on different conditions, you can add multiple measures.
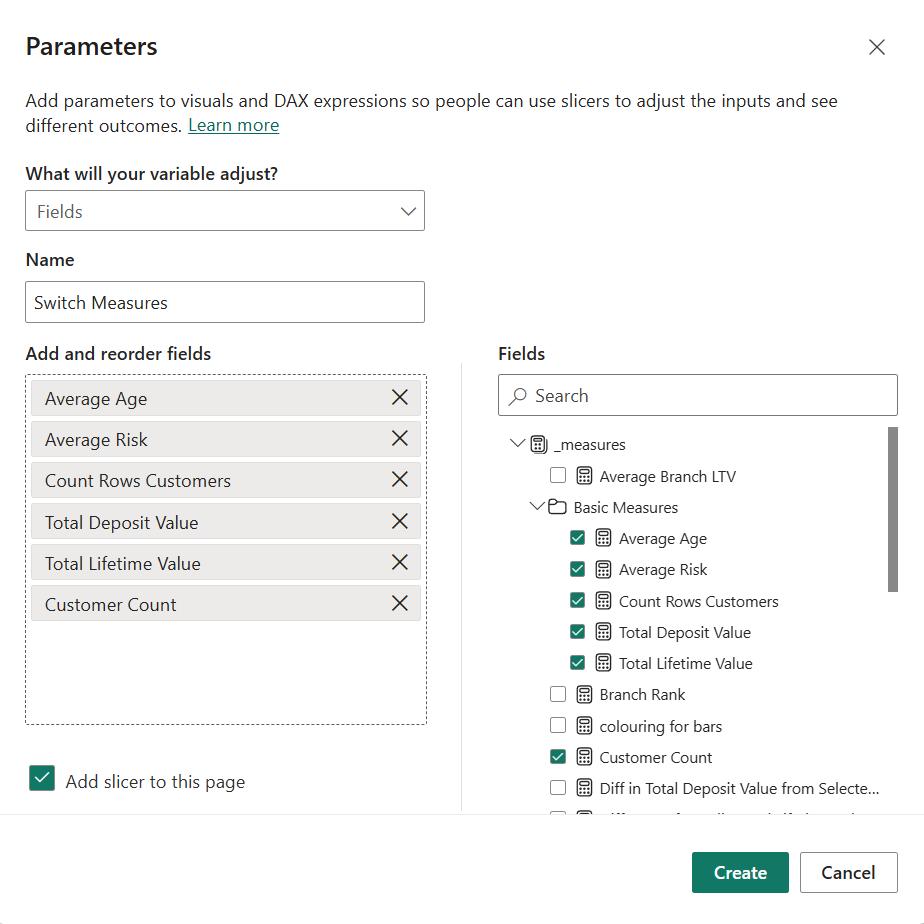
- Once you have added the fields you want in your parameter, click create.
The parameter will add a slicer to the page with the parameter. You can edit the settings of the parameter by going to format visual > visual > slicer settings > style.
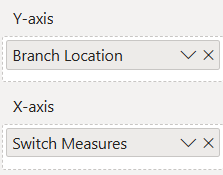
To activate the parameter, it is a lot easier than you may think. Simply go to the chart you are making the parameter for - for this example I will be using branch locations with the switch measures parameter. To activate the parameter in your bar chart, add the parameter to the X or Y axis (depending on what type of chart you are building):
Now, your parameter will update with the measures when you select on your slicer (parameter).
To edit a parameter, click on the field in the data pane and the DAX should pop up at the top of the screen. You can edit the DAX to change specifications / conditions of the parameter.
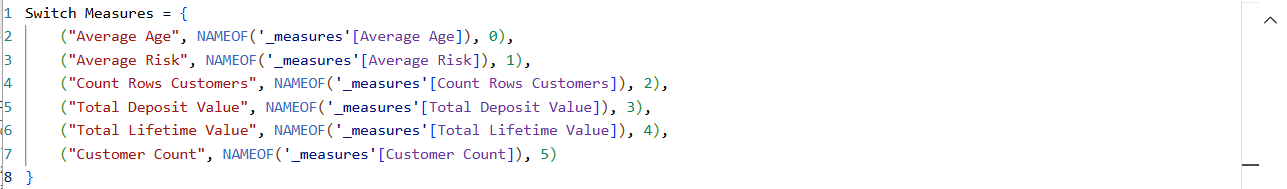
Using parameters in Power BI is great, because the DAX is automatically written when the parameters are created, so it makes them nice and simple to create and use.
In my next blog, I will look at creating Numeric Range parameters in Power BI - so make sure to look out for that!